
Mechanical model validation with geometry-linked UFF data
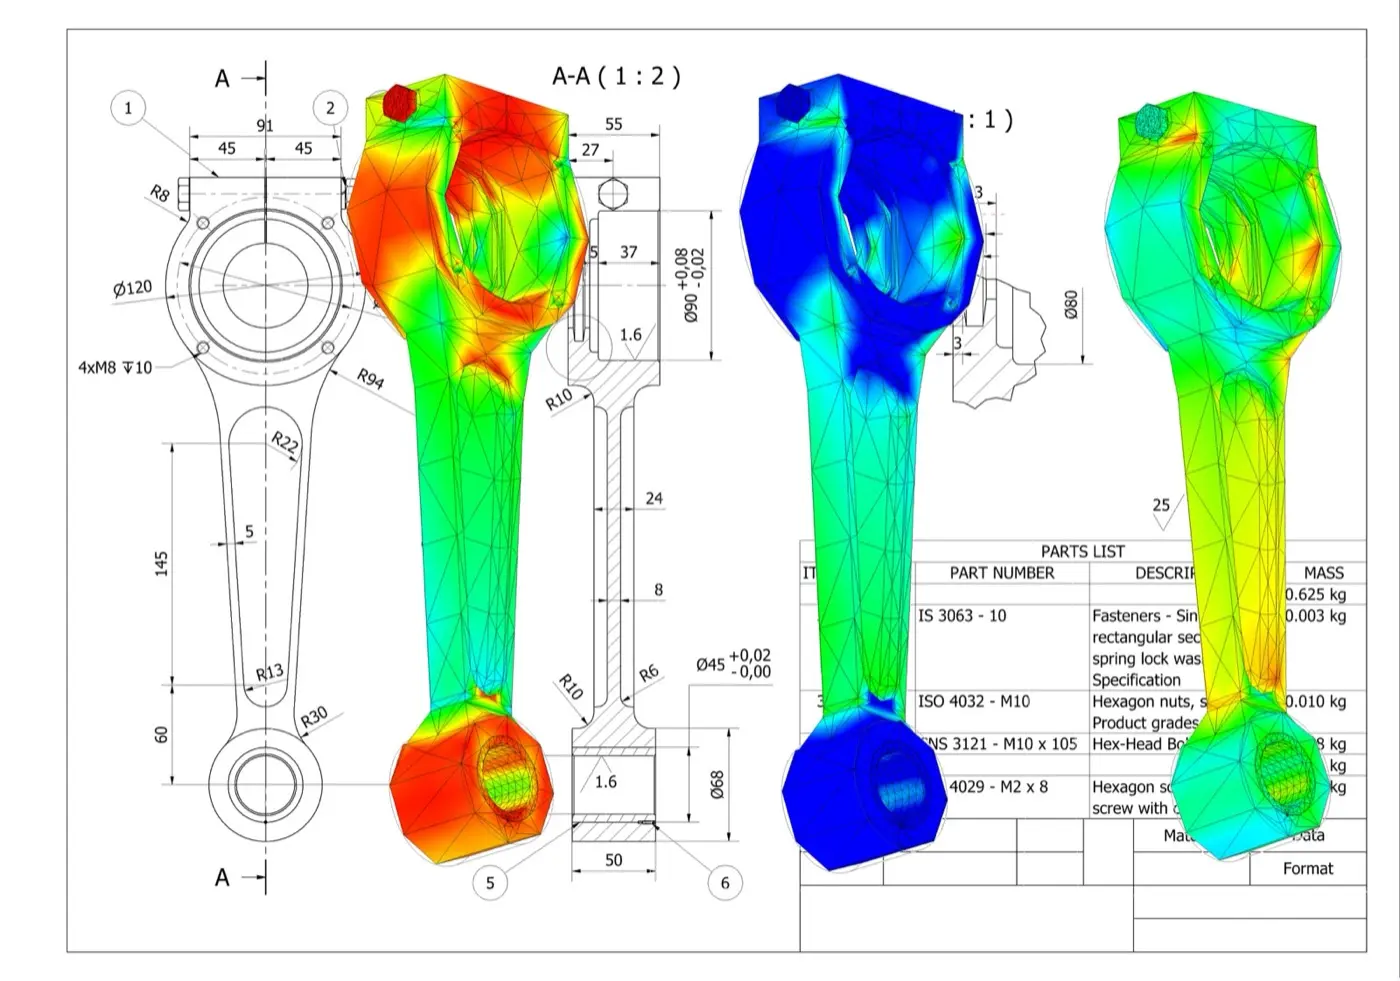
One UFF handoff
Geometry, waveforms and FRFs
XYZ coordinates, tri-axial velocity waveforms and FRFs remain associated with each measurement record.
A direct path from test to FE correlation
1. Define
Set the geometry, test points, response directions and excitation reference.
2. Measure
Capture dense non-contact velocity data and combine it with force, acceleration, displacement or strain references.
3. Correlate
Review modes, frequency and damping estimates, FRF overlays, MAC, COMAC and other correlation indicators.
4. Update
Focus the model on the joints, boundaries, material properties and local stiffness that drive the mismatch.
Keep response location and direction intact
Link point and response
Geometry and response records arrive together, so channels do not need to be reconstructed against coordinates.
Preserve direction
XYZ output identifies the response direction at each test degree of freedom.
Start analysis sooner
Import the test model and move into visualisation, parameter estimation and correlation.
See the regions that drive the mismatch

Complex structures
Cover panels, assemblies, frames and larger structures with the spatial detail needed to interpret the measured response.

Small components
Measure local mode shapes where conventional sensor placement is intrusive, impractical or too sparse.
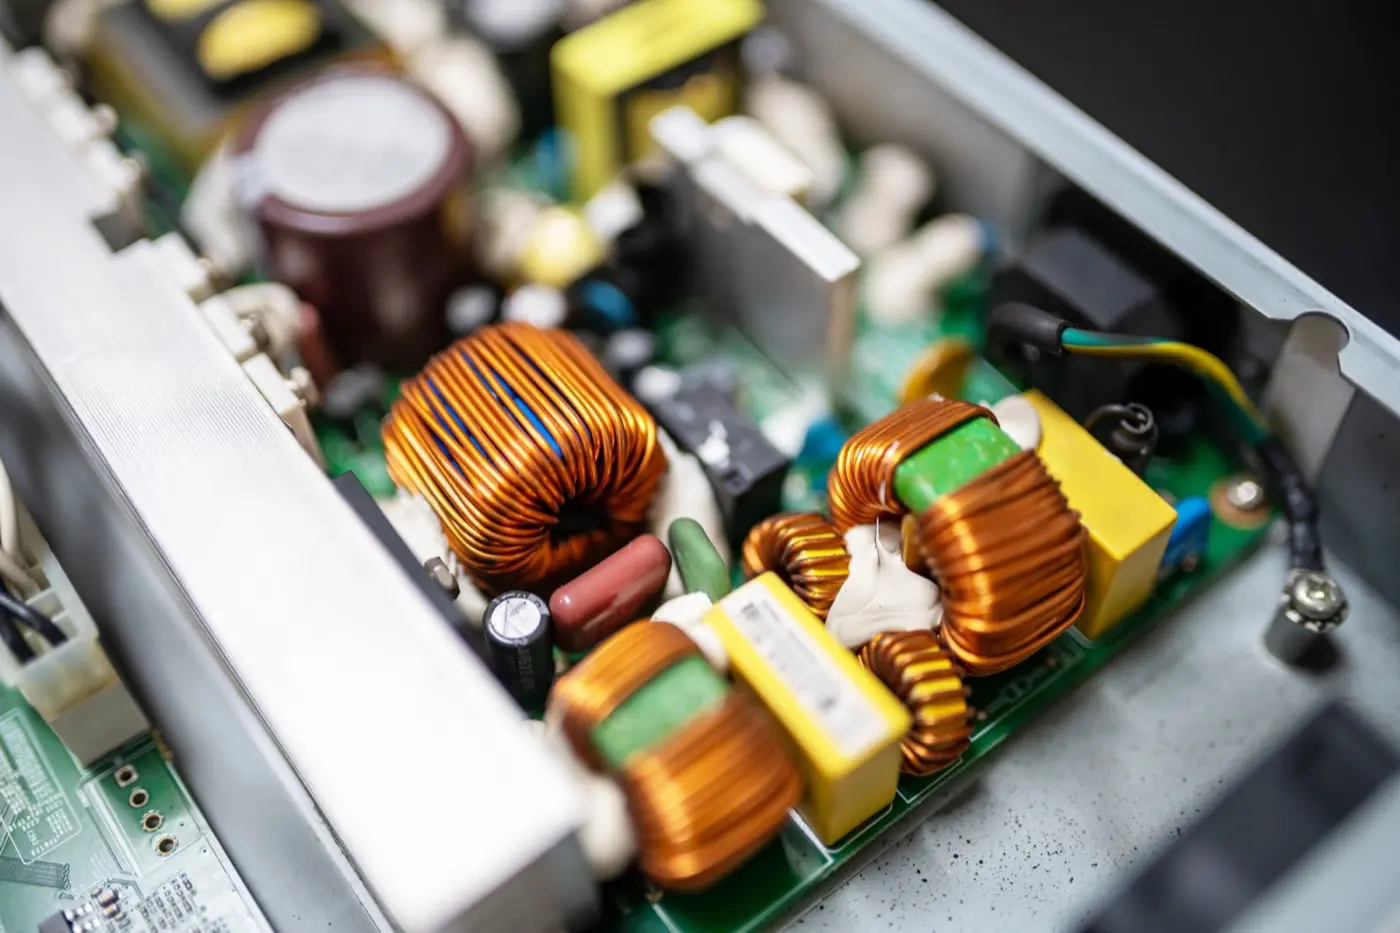
Measure small features without a dense sensor array
Use Laser RADAR for coverage and retain the complete test model
UFF export
Transport test geometry and structural-dynamics data into the modal and correlation environment your team uses.
Geometry-aware review
Open a test model with points, directions, waveforms and FRFs linked before animation or correlation begins.
Your analysis workflow
Keep your existing analysis package, naming conventions and validation criteria.
Resources for the next model-validation decision
Full-field modal-analysis workflow guide
Follow the end-to-end workflow from excitation and FRF acquisition through curve fitting, MAC review and UFF export.
Impact-test application note
See an impact-hammer test on a concrete slab using 65 simultaneous response measurements and geometry context.
PCB vibration application note
Explore high-density response measurement on populated electronics where local component behaviour drives qualification risk.
Products and application context
Q2 Laser RADAR
For complex parts, dense dynamic coverage and integrated 3D geometry in one measurement workflow.
Q1 Laser RADAR
For large or difficult-to-access structures that need stand-off geometry capture and vibration insight.
Acoustics, noise and vibration applications
Browse vibration, modal-testing and NVH applications by engineering question, structure and measurement constraint.
Practical answers before you plan the test
호환 가능한 후속 도구를 위해 측정 형상, 좌표와 Q-Series 진동 결과를 함께 유지할 수 있으며, 시험에 필요한 입력 기준이 있으면 응답과 FRF 데이터도 포함할 수 있습니다. 소프트웨어 버전과 워크플로에 맞춰 UFF 데이터셋, 단위, 좌표 규칙과 수신 도구 요구사항을 확인하십시오.
FRF는 주파수에 따라 측정된 구조 응답을 측정 입력과 연결합니다. 해머 또는 셰이커 모달 시험에서 공진을 식별하고 모달 파라미터를 추정하며 시험 응답을 유한요소 모델과 비교하는 데 사용합니다. 출력 전용 진동 스펙트럼은 자동으로 FRF가 아닙니다.
예. 해머 힘을 시간 정렬된 입력 기준으로 취득하고 Laser RADAR가 선택한 형상에서 진동 응답을 기록해야 합니다. FRF 계산 또는 내보내기 전에 트리거, 시간, 좌표 방향, 대역폭, 윈도잉과 힘 신호 품질을 관리해야 합니다.
좌표계, 측정 위치, 응답 방향, 단위, 경계 및 운용 조건, 주파수 범위와 비교 물리량을 맞추십시오. 명확한 대응은 고유진동수, 감쇠, 모드 형상과 FRF 차이를 설정이나 매핑의 인공물이 아닌 의미 있는 차이로 만듭니다.
예. 엔지니어가 측정 FRF 또는 식별한 모달 파라미터를 모델 예측과 비교하고 차이를 업데이트 방향에 활용할 수 있습니다. 소프트웨어가 모델을 자동 검증하거나 업데이트하지 않으며 파라미터 선택, 수용 기준과 해석은 분석에 포함됩니다.
아닙니다. UFF는 호환 가능한 형상과 측정 데이터의 전달을 단축할 수 있는 교환 형식입니다. 모달 식별, 상관, 모델 업데이트, 불확도 검토와 보고에는 적절한 후속 소프트웨어, 정의된 방법과 자격 있는 엔지니어링 판단이 필요합니다.