
Mechanical model validation with geometry-linked UFF data
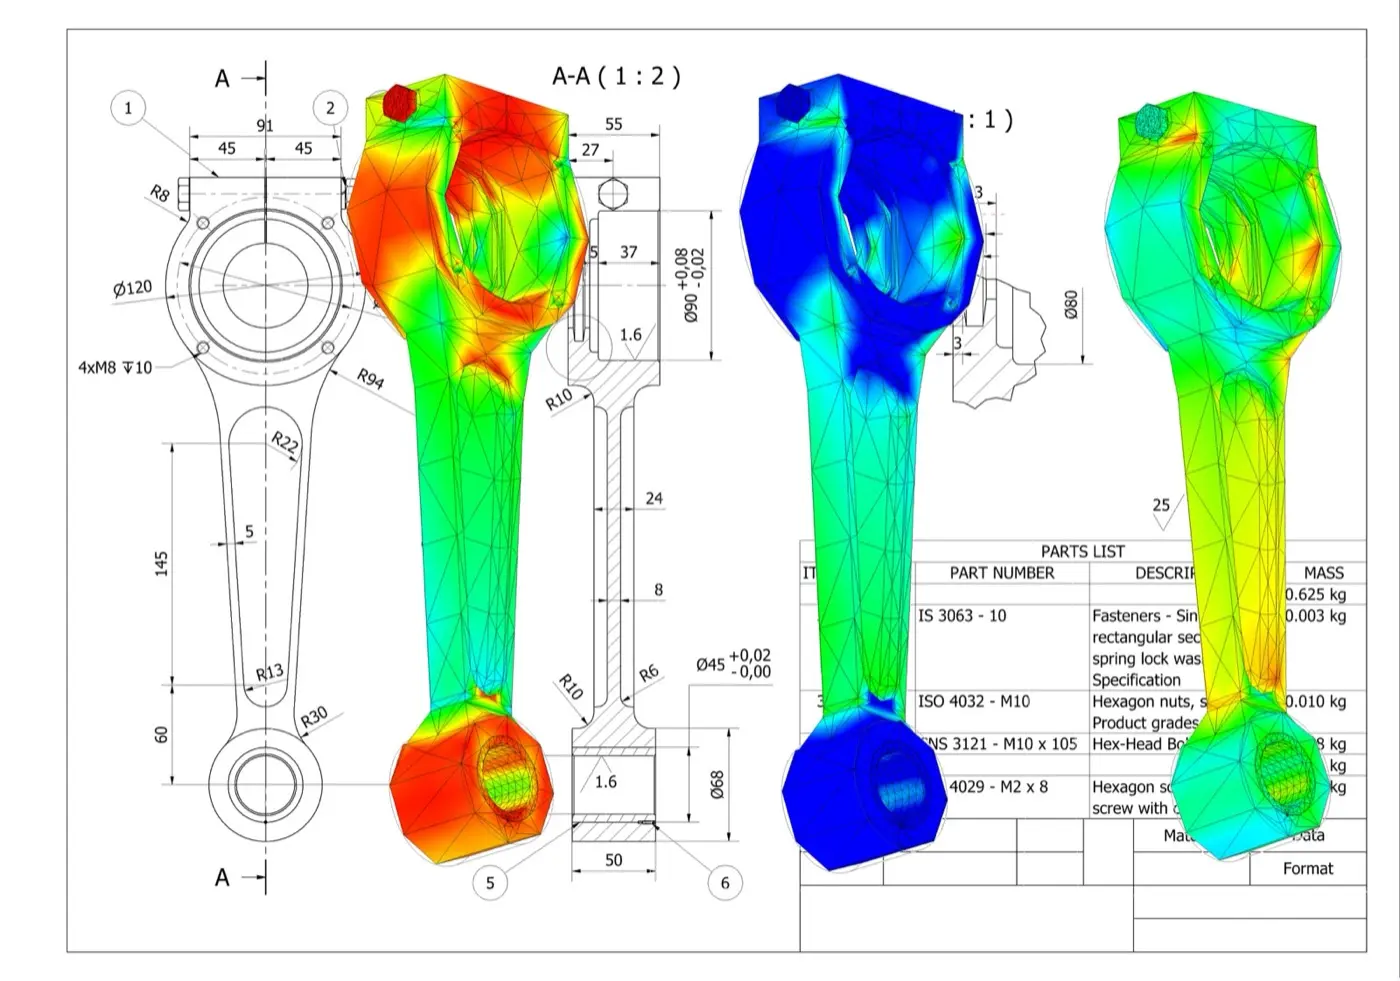
One UFF handoff
Geometry, waveforms and FRFs
XYZ coordinates, tri-axial velocity waveforms and FRFs remain associated with each measurement record.
A direct path from test to FE correlation
1. Define
Set the geometry, test points, response directions and excitation reference.
2. Measure
Capture dense non-contact velocity data and combine it with force, acceleration, displacement or strain references.
3. Correlate
Review modes, frequency and damping estimates, FRF overlays, MAC, COMAC and other correlation indicators.
4. Update
Focus the model on the joints, boundaries, material properties and local stiffness that drive the mismatch.
Keep response location and direction intact
Link point and response
Geometry and response records arrive together, so channels do not need to be reconstructed against coordinates.
Preserve direction
XYZ output identifies the response direction at each test degree of freedom.
Start analysis sooner
Import the test model and move into visualisation, parameter estimation and correlation.
See the regions that drive the mismatch

Complex structures
Cover panels, assemblies, frames and larger structures with the spatial detail needed to interpret the measured response.

Small components
Measure local mode shapes where conventional sensor placement is intrusive, impractical or too sparse.
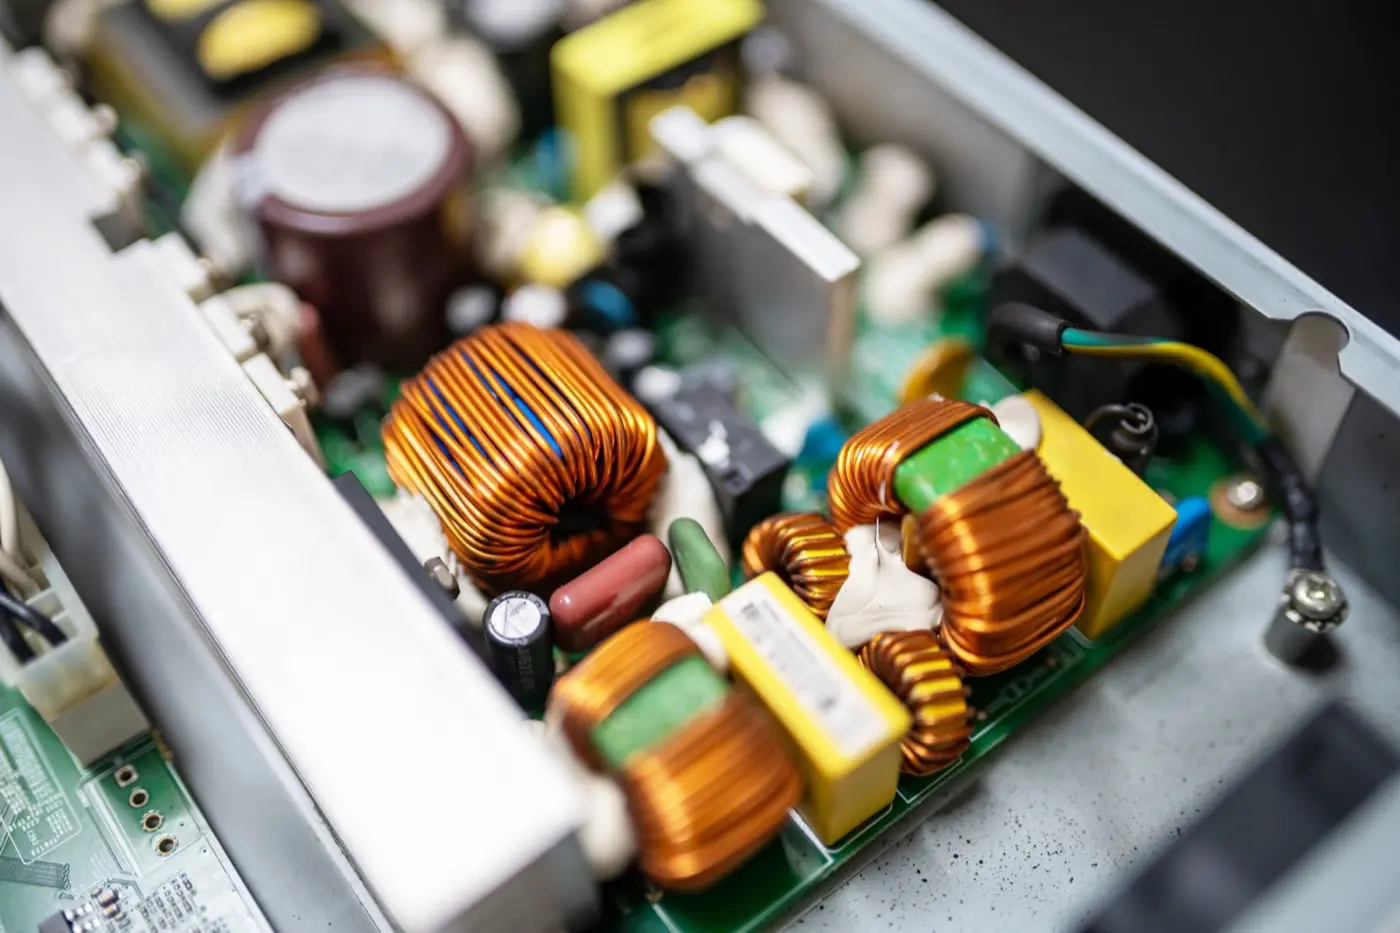
Measure small features without a dense sensor array
Use Laser RADAR for coverage and retain the complete test model
UFF export
Transport test geometry and structural-dynamics data into the modal and correlation environment your team uses.
Geometry-aware review
Open a test model with points, directions, waveforms and FRFs linked before animation or correlation begins.
Your analysis workflow
Keep your existing analysis package, naming conventions and validation criteria.
Resources for the next model-validation decision
Full-field modal-analysis workflow guide
Follow the end-to-end workflow from excitation and FRF acquisition through curve fitting, MAC review and UFF export.
Impact-test application note
See an impact-hammer test on a concrete slab using 65 simultaneous response measurements and geometry context.
PCB vibration application note
Explore high-density response measurement on populated electronics where local component behaviour drives qualification risk.
Products and application context
Q2 Laser RADAR
For complex parts, dense dynamic coverage and integrated 3D geometry in one measurement workflow.
Q1 Laser RADAR
For large or difficult-to-access structures that need stand-off geometry capture and vibration insight.
Acoustics, noise and vibration applications
Browse vibration, modal-testing and NVH applications by engineering question, structure and measurement constraint.
Practical answers before you plan the test
Der Export kann Messgeometrie, Koordinaten und Q-Series-Schwingungsergebnisse für kompatible Folgewerkzeuge zusammenhalten, einschließlich Antwort- und FRF-Daten, wenn die Prüfung die nötige Eingangsreferenz liefert. Bestätigen Sie Datensatz, Einheiten, Koordinatenkonvention und Anforderungen des Zielwerkzeugs für Version und Ablauf.
Eine FRF setzt die gemessene Strukturantwort über der Frequenz in Beziehung zu einem gemessenen Eingang. Bei Hammer- oder Shaker-Modaltests hilft sie, Resonanzen zu erkennen, Modalparameter zu schätzen und die Testantwort mit einem FE-Modell zu vergleichen. Ein reines Ausgangsspektrum ist nicht automatisch eine FRF.
Ja, wenn die Hammerkraft als zeitlich ausgerichtete Eingangsreferenz erfasst wird und Laser-RADAR die Antwort über die gewählte Geometrie misst. Triggerung, Zeitbezug, Koordinatenrichtungen, Bandbreite, Fensterung und Kraftqualität müssen vor Berechnung oder Export der FRF kontrolliert werden.
Stimmen Sie Koordinatensystem, Messorte, Antwortrichtungen, Einheiten, Rand- und Betriebsbedingungen, Frequenzbereich und Vergleichsgröße ab. Klare Zuordnung macht Unterschiede bei Eigenfrequenz, Dämpfung, Modenform und FRF aussagekräftig statt zu Aufbau- oder Zuordnungsartefakten.
Ja. Fachleute können gemessene FRF oder identifizierte Modalparameter mit Modellvorhersagen vergleichen und Unterschiede für Aktualisierungen nutzen. Die Software validiert oder aktualisiert das Modell nicht automatisch; Parameterauswahl, Akzeptanzkriterien und technische Interpretation bleiben Teil der Analyse.
Nein. UFF ist ein Austauschformat, das die Übergabe kompatibler Geometrie- und Messdaten verkürzen kann. Modalidentifikation, Korrelation, Modellaktualisierung, Unsicherheitsprüfung und Bericht benötigen weiterhin geeignete Software, eine definierte Methode und qualifiziertes technisches Urteil.