
Mechanical model validation with geometry-linked UFF data
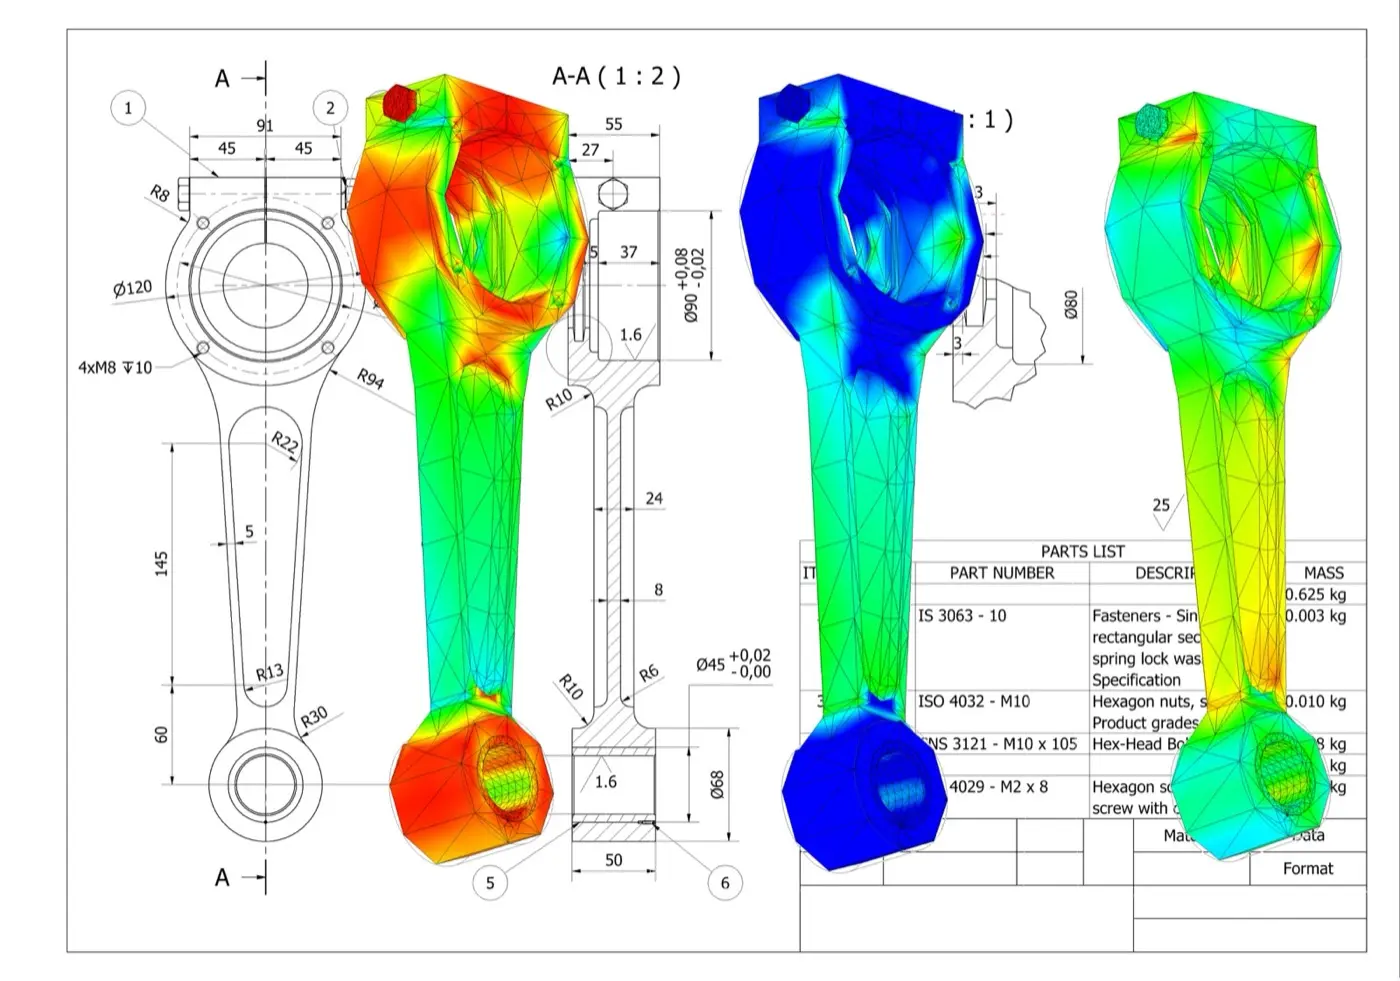
One UFF handoff
Geometry, waveforms and FRFs
XYZ coordinates, tri-axial velocity waveforms and FRFs remain associated with each measurement record.
A direct path from test to FE correlation
1. Define
Set the geometry, test points, response directions and excitation reference.
2. Measure
Capture dense non-contact velocity data and combine it with force, acceleration, displacement or strain references.
3. Correlate
Review modes, frequency and damping estimates, FRF overlays, MAC, COMAC and other correlation indicators.
4. Update
Focus the model on the joints, boundaries, material properties and local stiffness that drive the mismatch.
Keep response location and direction intact
Link point and response
Geometry and response records arrive together, so channels do not need to be reconstructed against coordinates.
Preserve direction
XYZ output identifies the response direction at each test degree of freedom.
Start analysis sooner
Import the test model and move into visualisation, parameter estimation and correlation.
See the regions that drive the mismatch

Complex structures
Cover panels, assemblies, frames and larger structures with the spatial detail needed to interpret the measured response.

Small components
Measure local mode shapes where conventional sensor placement is intrusive, impractical or too sparse.
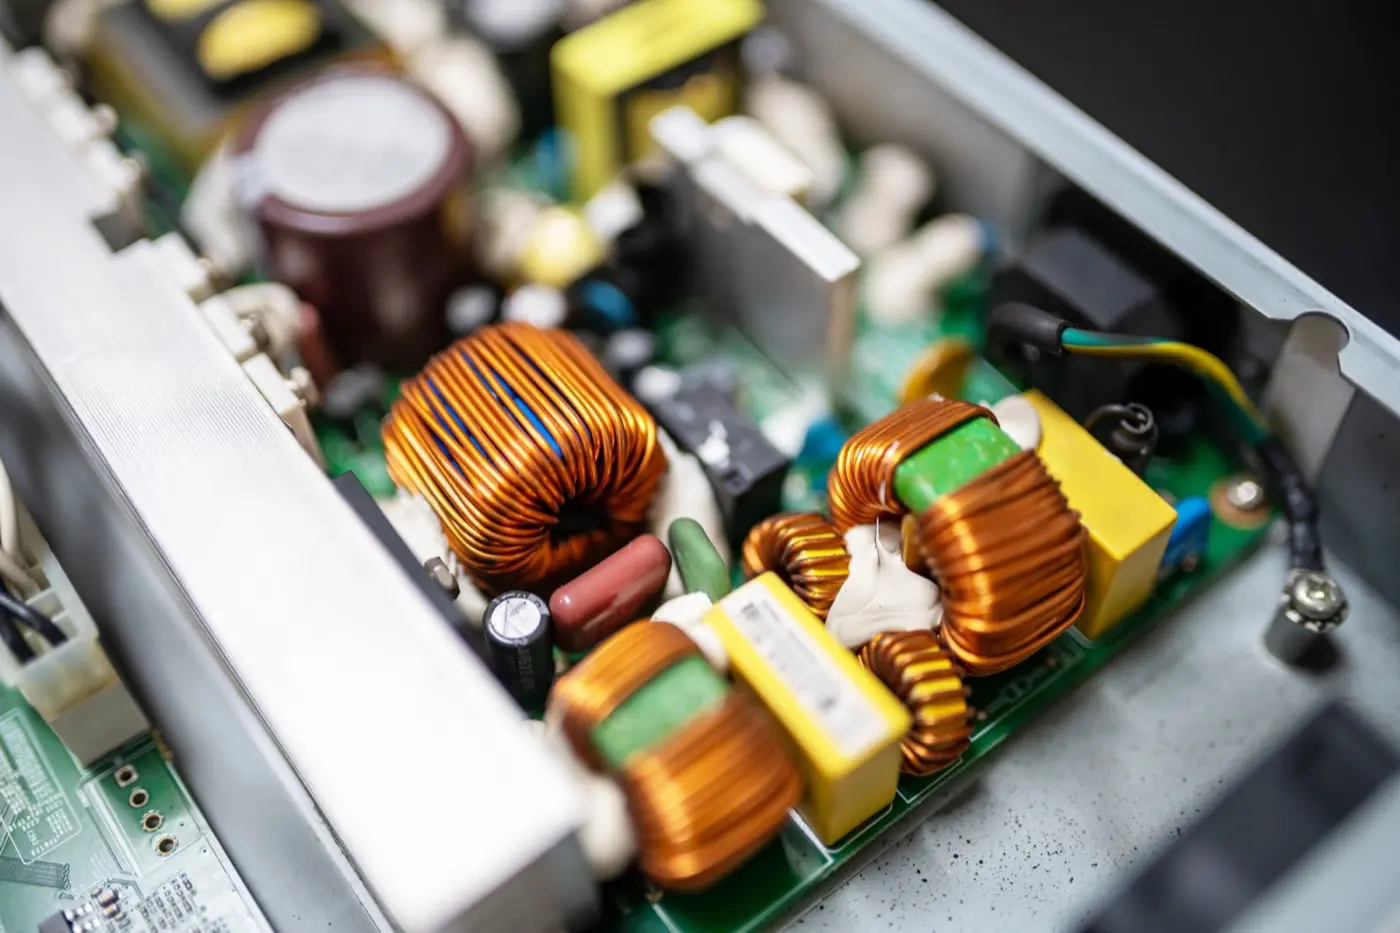
Measure small features without a dense sensor array
Use Laser RADAR for coverage and retain the complete test model
UFF export
Transport test geometry and structural-dynamics data into the modal and correlation environment your team uses.
Geometry-aware review
Open a test model with points, directions, waveforms and FRFs linked before animation or correlation begins.
Your analysis workflow
Keep your existing analysis package, naming conventions and validation criteria.
Resources for the next model-validation decision
Full-field modal-analysis workflow guide
Follow the end-to-end workflow from excitation and FRF acquisition through curve fitting, MAC review and UFF export.
Impact-test application note
See an impact-hammer test on a concrete slab using 65 simultaneous response measurements and geometry context.
PCB vibration application note
Explore high-density response measurement on populated electronics where local component behaviour drives qualification risk.
Products and application context
Q2 Laser RADAR
For complex parts, dense dynamic coverage and integrated 3D geometry in one measurement workflow.
Q1 Laser RADAR
For large or difficult-to-access structures that need stand-off geometry capture and vibration insight.
Acoustics, noise and vibration applications
Browse vibration, modal-testing and NVH applications by engineering question, structure and measurement constraint.
Practical answers before you plan the test
导出可为兼容的后续工具将测量几何、坐标和 Q-Series 振动结果保存在一起;当试验提供所需输入参考时,也可包括响应和 FRF 数据。应针对软件版本和流程确认具体 UFF 数据集、单位、坐标约定以及接收工具要求。
FRF 表示测得的结构响应与测得的输入随频率的关系。在冲击锤或激振器模态试验中,它有助于识别共振、估计模态参数并将试验响应与有限元模型比较。仅有输出的振动频谱不会自动成为 FRF。
可以,但必须将锤击力作为时间对齐的输入参考采集,并由 Laser RADAR 记录所选几何上的振动响应。在计算或导出 FRF 前,必须控制触发、时间、坐标方向、带宽、加窗和力信号质量。
应匹配坐标系、测量位置、响应方向、单位、边界与运行条件、频率范围和比较物理量。清晰的对应关系使固有频率、阻尼、模态振型和 FRF 的差异具有意义,而不是设置或映射造成的假象。
可以。工程师可审查测得的 FRF 或识别的模态参数,与模型预测比较,并用观察到的差异指导更新。软件不会自动验证或更新模型;参数选择、验收标准和工程解释仍是分析的一部分。
不能。UFF 是一种交换格式,可缩短兼容几何和测量数据的交接。模态识别、相关、模型更新、不确定度审查和报告仍需要合适的后续软件、明确的方法和合格的工程判断。