Application note | Civil infrastructure
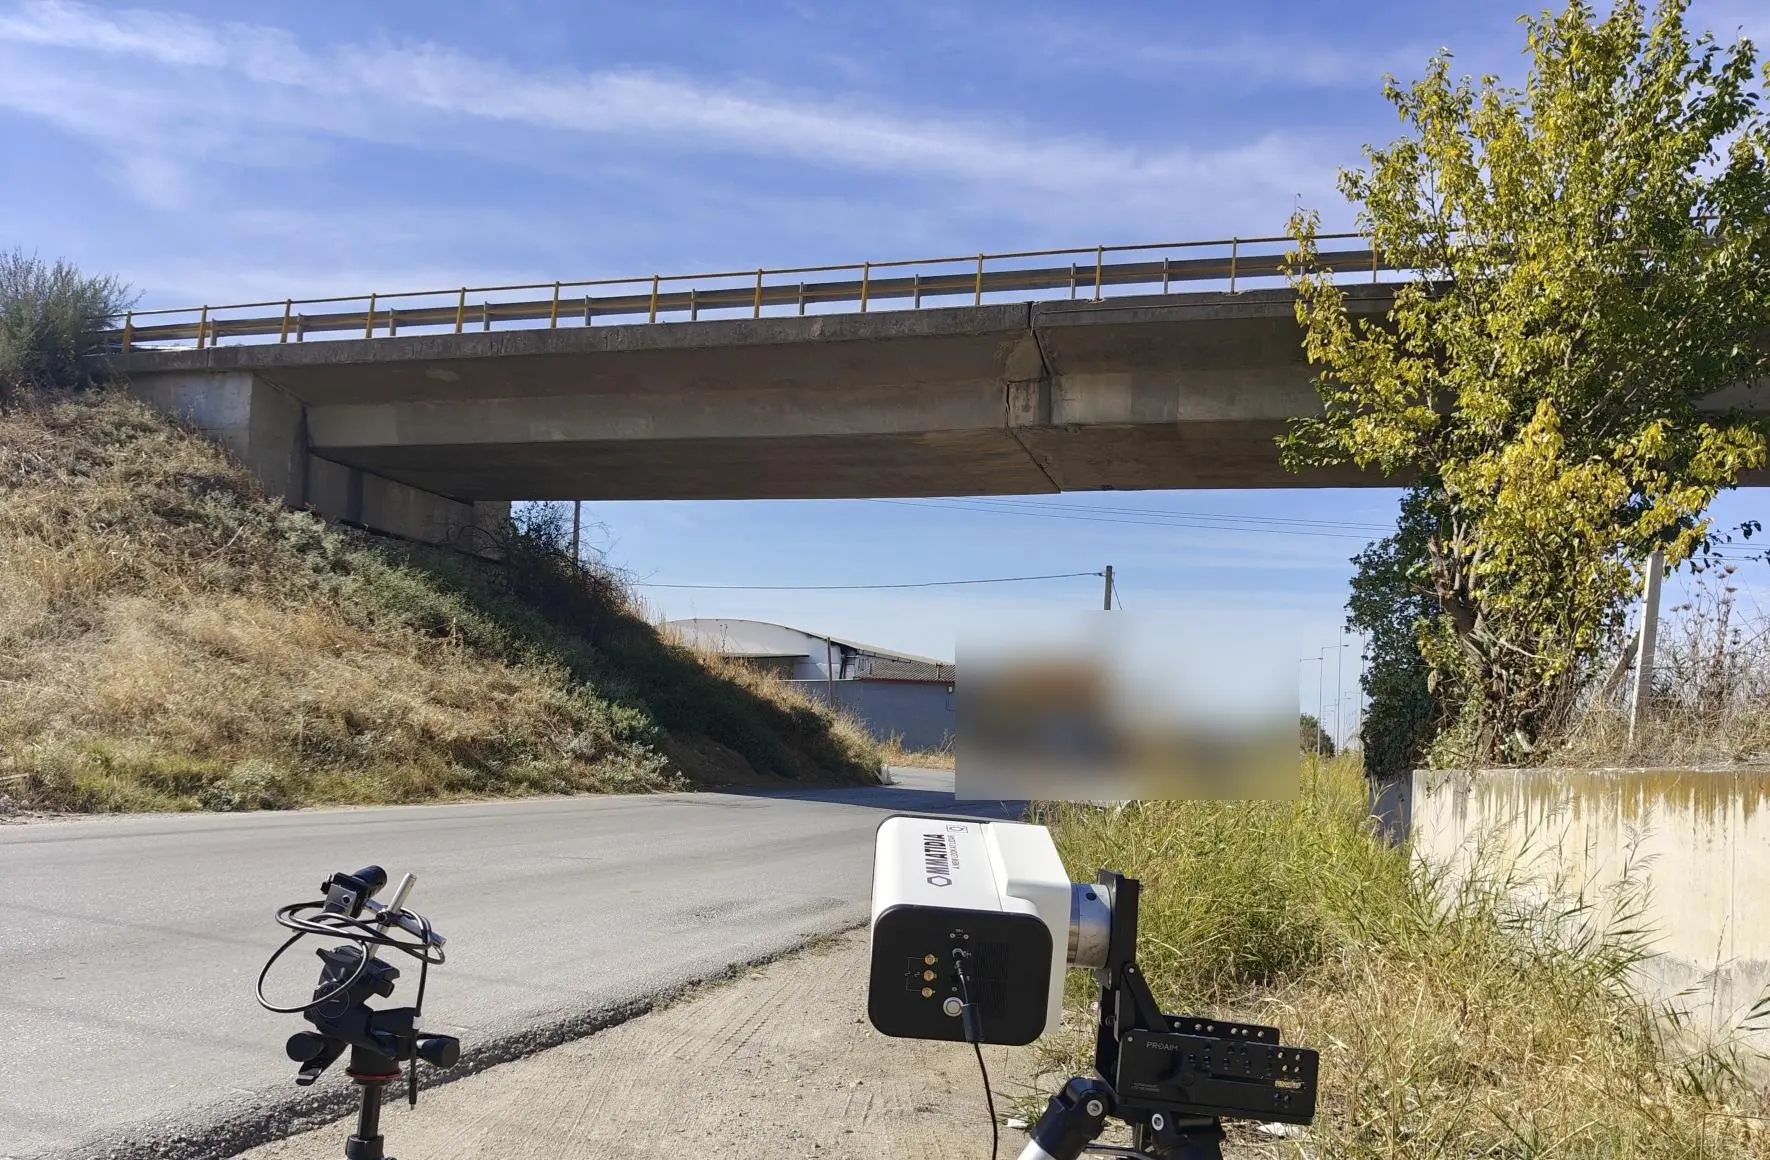
Q-series LDV systems measure dense displacement and velocity profiles along a bridge without installing strain gauges. For beam-like, bending-dominated response, those profiles can be converted into curvature and surface strain using Euler-Bernoulli beam theory.
Why it matters
Bridge strain insight without contact instrumentation
Q-series measurements give engineering teams a faster way to screen bridge behavior: capture many points remotely, recover the displacement profile, and turn the spatial shape into curvature and strain indicators where the structural model supports it.
Measurement workflow
Less setup before useful data
Conventional gauges are valuable, but they add surface preparation, wiring, access planning, and installation time. A remote LDV line can be deployed from a safe viewpoint and repeated during normal traffic or controlled excitation.
Model choice
Use one line when bending dominates
One-line strain extraction is best suited to beam-like bridge regions where bending drives the response. Near supports, discontinuities, or zones with meaningful axial motion, add a second viewing position so axial and bending terms can be separated.
Method
From LDV displacement to Euler-Bernoulli strain
For a bridge deck or girder segment that can be approximated as an Euler-Bernoulli beam, the vertical displacement shape contains curvature. Surface strain follows from that curvature and the distance from the neutral axis to the measurement surface.
κ(x,t) ≈ ∂2w(x,t)∂x2
εb(x,z,t) = −z · κ(x,t)
Here, w(x,t) is vertical deflection along the measurement line, kappa is curvature, and z is the distance from the neutral axis. In practice, the quality of the spatial derivative depends on point spacing, signal quality, filtering, and geometry calibration.
Measure a dense line
Q-series LDV captures many points simultaneously along the bridge soffit or visible structural line during the same vehicle, train, or ambient excitation event.
Recover the shape
Velocity signals are processed into displacement or displacement-derived profiles, with geometry and line-of-sight projection handled explicitly.
Convert to strain
For bending-led response, curvature is extracted from the spatial profile and converted into surface strain using the section geometry.
Geometry
Sensor geometry defines the measurement line
The first practical step is to turn the bridge and sensor setup into a measurement coordinate system. The Q-series unit observes a line of visible points on the bridge soffit or girder. Each point has a known position along the bridge span, a line-of-sight direction back to the sensor, and a spacing to the neighboring points.
That geometry matters because strain is not measured directly at one isolated point. It is inferred from how the bridge shape changes along the line. If point spacing is uneven, if the sensor views the deck at an angle, or if part of the line is closer to a support or discontinuity, those details affect the displacement profile, the spatial derivative, and therefore the curvature and strain estimate.

For independent context on using multi-point laser Doppler vibrometry for bridge inspection, see the U.S. Department of Transportation research.
Field output
Velocity, displacement, and strain remain connected
A single event can be reviewed at multiple levels. The LDV signal starts as velocity, can be integrated into displacement, and can then feed the curvature and strain calculation when the structural assumptions are valid. Showing these traces together helps engineers check whether the derived strain is physically plausible.

Dynamic strain vs time
Track strain response during vehicle passages, train crossings, impact events, or controlled excitation.
Curvature along the line
Identify where the bridge shape changes most strongly and where strain concentration is likely.
Repeatable hot spots
Return to the same remote geometry in follow-up campaigns and compare trendable indicators over time.
Field video
Spatial and temporal bridge strain during high-speed train passage
This field clip shows the spatial and temporal strain profile of a concrete bridge as a high-speed train crosses the structure. It connects the application note’s strain-ready workflow to a real dynamic event, where the response evolves along the bridge line and over time.
Measurement model
Start simple, then add views when the physics requires it
The bending-dominated model is the fastest bridge-strain workflow. It uses one measurement line and one remote position, then converts deflection curvature into bending strain. For support regions, local discontinuities, or cases where axial motion is not negligible, use two independent line-of-sight measurements to reconstruct in-plane motion in the measurement plane.

Connected reading
Where this fits in the Ommatidia workflow
This application note connects remote vibrometry, structural health monitoring, and photonic parallel measurement. The same Q-series architecture that captures 65 or 128 points simultaneously also enables spatial derivatives that are impractical with slow point-by-point scans.
Want to test strain-ready bridge vibrometry?
Share the bridge type, access constraints, expected excitation, and available structural model. We can help define whether a single Q-series line is enough or whether a multi-view campaign is more appropriate.