SEE MORE · KNOW MORE

See how instruments create their sound
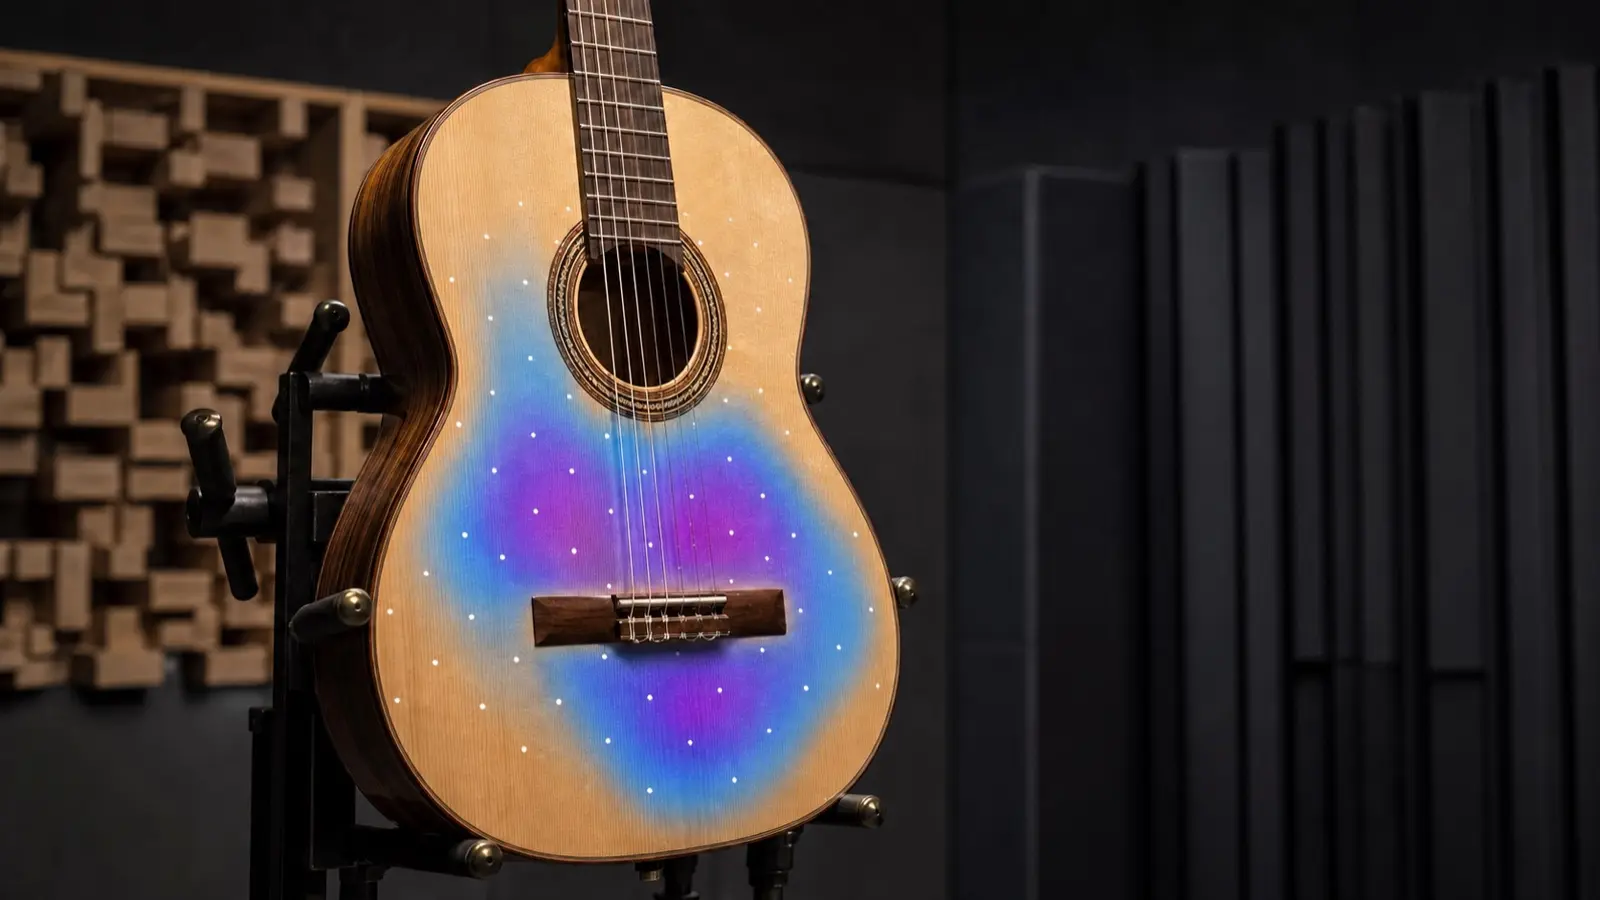
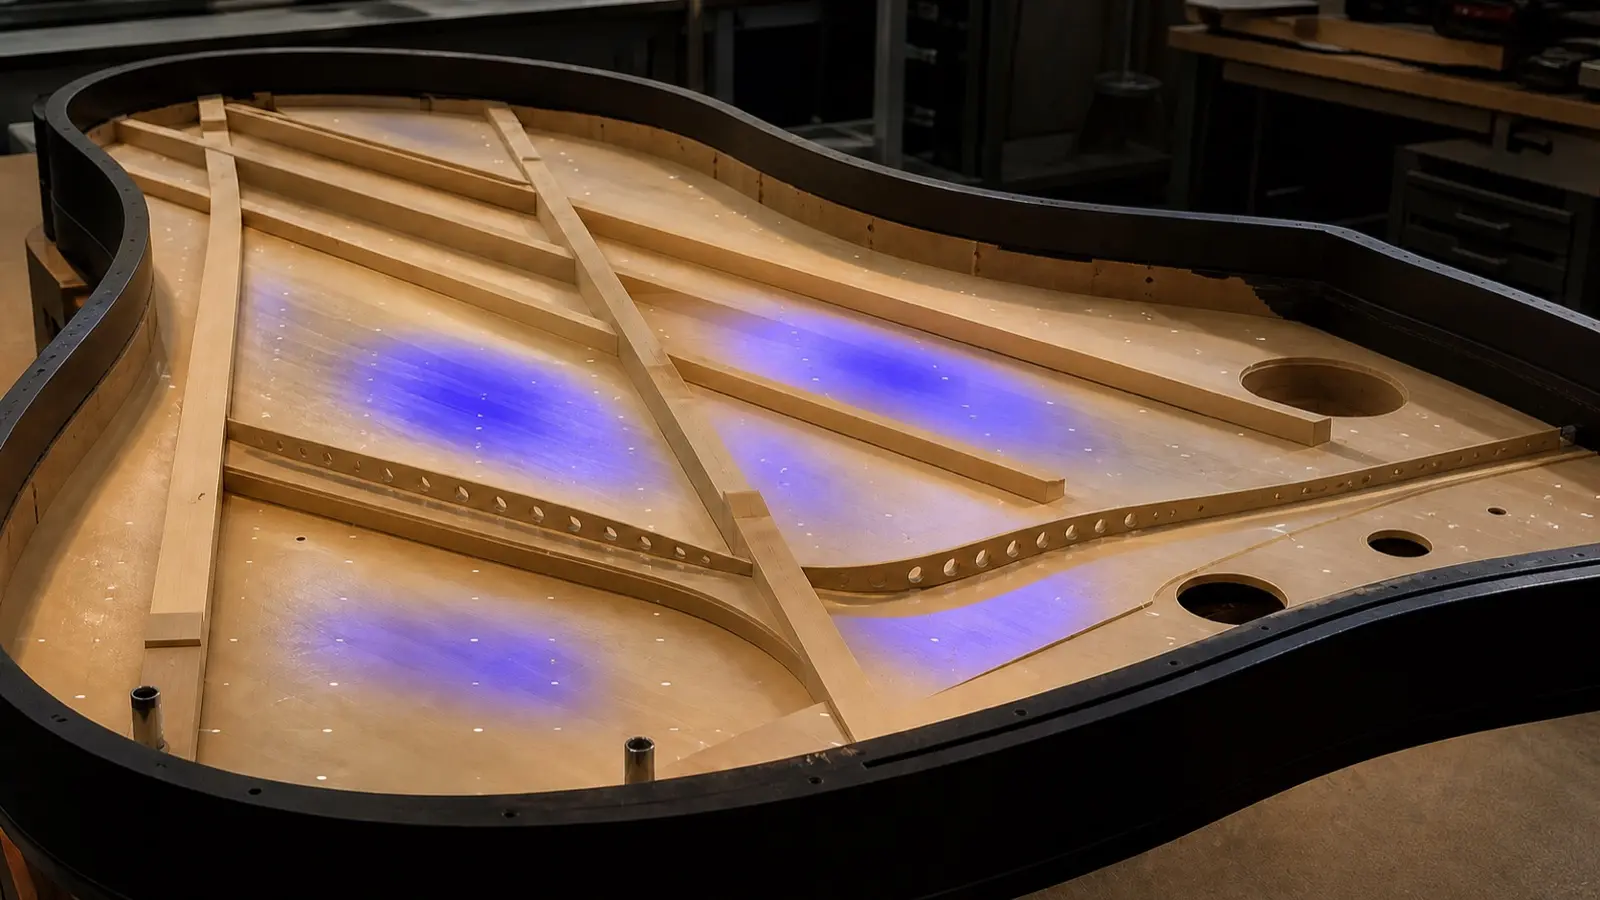
Ommatidia QSeries Laser RADAR systems measure geometry and vibration across many points in parallel. Map the structural motion behind musical instruments, loudspeakers and resonant components—without dense sensor installation.
musical instrument soundboard vibration v3
piano soundboard modal testing v3

Map the structure behind timbre, projection and feel

Instrument sound comes from coupled motion. Strings or an actuator drive the bridge, body, soundboard and enclosed air; the resulting pattern shapes what players and listeners hear. Ommatidia Laser RADAR maps the surface response across many points so teams can locate the mode, brace region or boundary condition that deserves attention.

The instrument-development decisions that need a spatial answer

Choose a measurement plan when a sound judgment has to become a design, production or repair action.

Tune the body and soundboard

Compare plate, brace, bridge and boundary-condition response before deciding what to adjust.

Resolve unwanted resonances

Locate the structural feature behind a wolf tone, buzz, rattle or narrow-band colouration.

Compare prototypes and production variation

Build a repeatable response map across material batches, assembly variants or reference instruments.

Validate a physical or numerical model

Compare measured mode shapes and frequencies with an FE or physical model before trusting the next iteration.

Find the mode behind a loudspeaker response problem
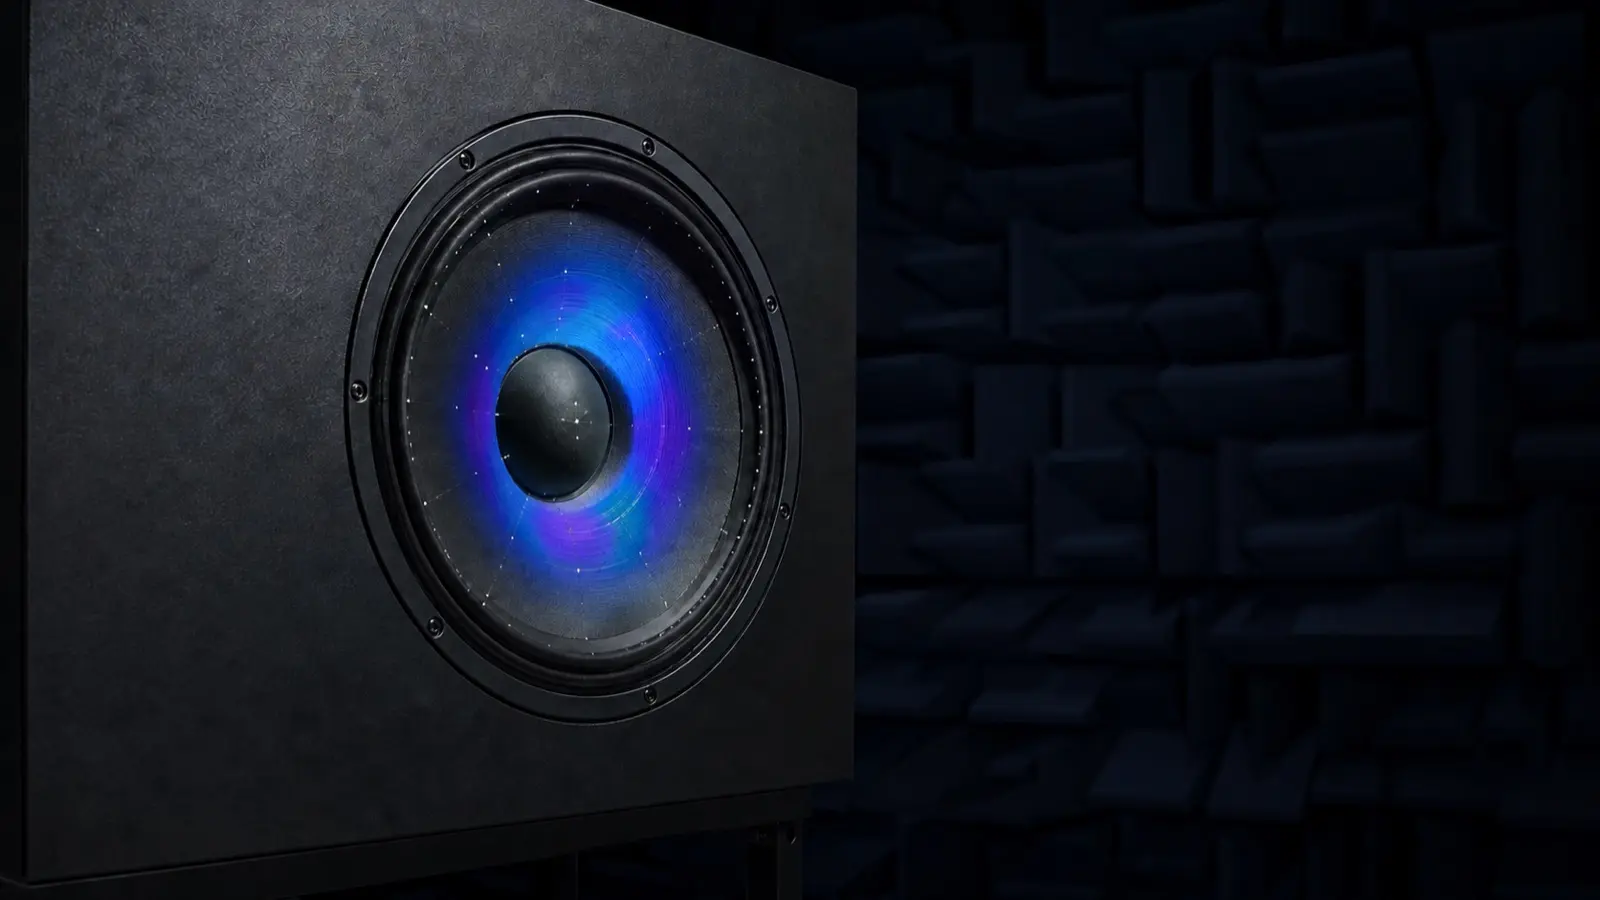
A frequency-response failure can originate in the cone, surround, dust cap, suspension or enclosure. Measure vibration across the diaphragm to reveal non-rigid behaviour, asymmetry and localized modes that a single point can miss.
Use the motion map alongside acoustic and electrical data to narrow the corrective action.
loudspeaker diaphragm vibration v3

Use the signal that answers the instrument question

The most useful campaigns connect the acoustic outcome with the mechanical response. QSeries Laser RADAR adds the multi-point spatial view.

Microphones — acoustic outcome

Measure the sound at the listener or microphone position. Use them for sound-pressure, radiation and listening correlation.

Force input — controlled excitation

Define the input for a modal test. Use it when you need a controlled excitation and a transfer function.

Accelerometers — selected-point motion

Capture motion at selected points. Best for trusted references and known critical components.

QSeries Laser RADAR — spatial response

Map geometry and vibration across many points in parallel. Use it to show how the body, soundboard or diaphragm is moving.

Bring geometry and motion into the acoustic investigation

Watch how a Q1 Laser RADAR system turns a guitar body into a spatial measurement target. The example is a useful starting point for research, design review and sound-radiation studies.

From result to design decision

Bring the vibration map together with the acoustic test, material choice and construction detail. Then decide where to change the structure—not only which frequency to chase.
Video: Guitar spectrum and modal shapes measured with Ommatidia Q1 Laser RADAR.

Choose your next step

Bring a prototype, a reference instrument or a troublesome production sample to a focused engineering conversation.

Explore Q1 Laser RADAR

Explore multi-point geometry and vibration measurement for focused structural studies.

Explore Q2 Laser RADAR

Explore the system for high-density, parallel measurement across larger or more complex targets.

Discuss your application

Bring the instrument, loudspeaker or component question to an applications engineer.

Instrument vibrometry questions, answered

QSeries Laser RADAR measures geometry and vibration across many points in parallel. Use it to map the structural motion of a soundboard, body, bridge, diaphragm or resonant component.
Yes. Pair the acoustic result with a spatial vibration map to see which areas of the structure are active at the frequencies that matter. This turns a subjective sound judgment into a testable structural question.
Yes. Use the measurement plan around the suspected operating condition, then map the local response across the body, fittings and nearby components to focus the diagnostic work.
Yes. A consistent excitation and measurement plan makes it possible to compare response patterns across prototypes, materials, assembly variants or reference instruments.
Yes. Compare measured frequencies and spatial mode shapes with the physical or numerical model, then use the difference to refine material, geometry, boundary-condition or damping assumptions.
Yes. Map the cone, surround, dust cap and nearby structure to identify non-rigid behaviour, asymmetry and local modes alongside acoustic and electrical measurements.
No. Microphones measure the acoustic outcome. Laser RADAR adds the mechanical view of the surface response. Together, they give a stronger route from what is heard to what should change.
Laser Doppler vibrometry provides velocity and vibration information. Ommatidia QSeries Laser RADAR brings that capability together with geometry measurement and parallel multi-point acquisition.
String, bridge and body studies each need their own measurement plan. Bring the target, excitation and temporal question to the first discussion so the right measurement locations and setup can be defined.
Bring the object, the sound or vibration question, available excitation, access, expected frequency range and any recordings or model data. That is enough to define a useful starting route.

Discuss your instrument-vibrometry application

Share the instrument, component or loudspeaker problem, the operating condition and the decision you need to make. We’ll help you plan a practical QSeries measurement route.