OMMATIDIA Q-SERIES SOFTWARE FOR LASER VIBROMETRY

Q-Series software for laser vibrometry

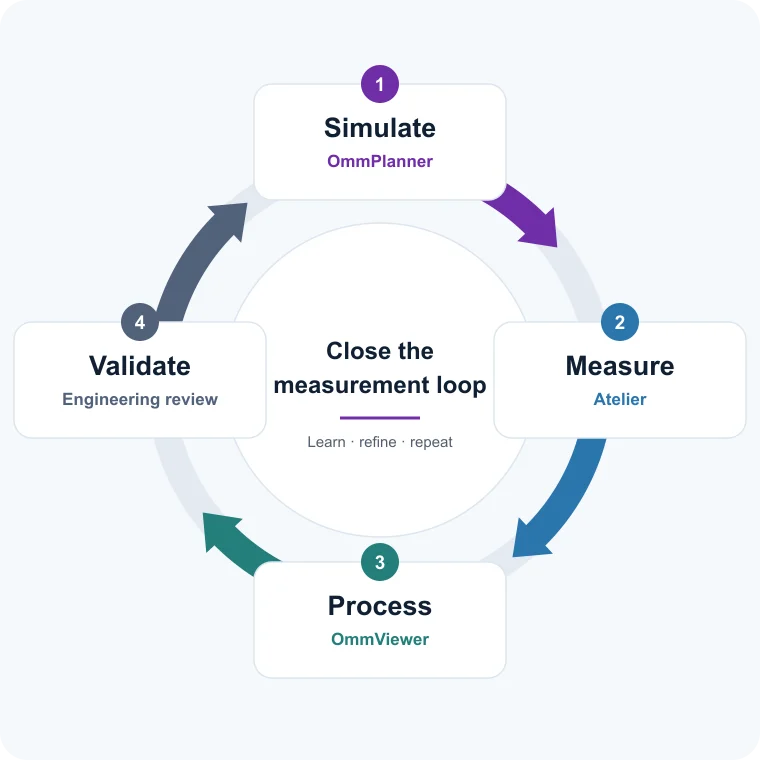
Close the loop around your measurement problem. Simulate your setup with OmmPlanner, measure with Atelier, then process and validate the results with OmmViewer and your engineering tools. Each cycle helps you refine the next measurement and move from a test question to a clear engineering answer.

Simulate → measure → process → validate. Refine the setup, repeat the cycle.
istock 1176842849 atelier workstation
THE Q-SERIES WORKFLOW

Close the measurement loop

Three complementary applications connect preparation, acquisition and analysis. Bring what you learn from the results back into the next measurement plan.
Continuous improvement cycle: simulate with OmmPlanner, measure with Atelier, process with OmmViewer, validate results, and refine the next measurement plan.

1. Simulate

Explore your 3D geometry in OmmPlanner. Compare instrument positions, viewing directions and coverage before going on site.

2. Measure

Configure the scan in Atelier, align the target and capture live signals, geometry and HDF5 measurement data.

3. Process

Open the dataset in OmmViewer to inspect spectra, waveforms and mode maps in their geometric context.

4. Validate

Compare the measured response with your engineering expectations. Export the results and use the findings to refine your next setup.

BEFORE THE MEASUREMENT

OmmPlanner turns your geometry into a measurement plan

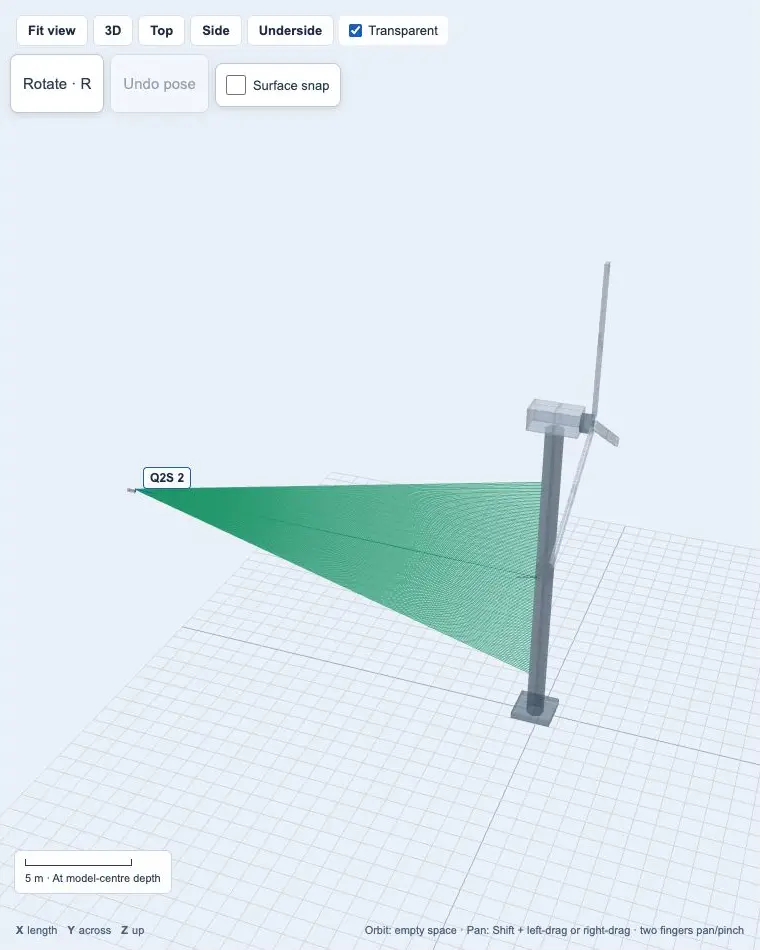
Start with a 3D model and explore how to measure it. Position Q-Series instruments, compare viewing angles and coverage, and choose the surfaces that answer your test question. OmmPlanner brings simulation into the workflow before the first scan.

Try OmmPlanner Lite in your browser, or use Web to save your setup and share a planning report with your team.

ommplanner web 044 wind turbine view
atelier workflow
AT THE INSTRUMENT

Atelier captures the measurement

Set the scan, align the target and review live signals, intensity and geometry while the measurement is running.
AFTER THE ACQUISITION

OmmViewer analyses the dataset

Inspect spectra and mode maps, compare the response with geometry and prepare the data for a repeatable downstream handoff.
OmmViewer mode map
TYPICAL ENGINEERING TASKS

Use the software around the test question

Plan the views, capture the response and interpret the results around the same engineering question.

Modal and NVH testing

Connect the recorded response to frequency, mode-shape and vibration questions in remote laser vibrometry.

3D and geometry-aware review

Use point-cloud-aware views when geometry provides essential context for interpreting the result.

HDF5 to downstream data

Keep data and metadata together in HDF5, then use UFF export for compatible modal-data handoffs.
OmmViewer spectrum
EXPORT FOLLOWS THE ANALYSIS

Turn validated results into the next measurement plan

HDF5 keeps measurement data and metadata together. Export geometry and vibrometry in UFF, CSV or HDF5 to connect the measured response with design validation and downstream engineering analysis.
Bring the findings back to OmmPlanner to refine instrument positions and coverage for the next test. The loop keeps your measurement strategy connected to the engineering question.

Build the measurement loop around your application

From modal and NVH testing to geometry-aware vibration studies, our engineers can help you connect simulation, measurement, processing and validation. Bring your target, test question and required outputs to the conversation.

Q-Series software questions

Simulate → measure → process → validate. Refine the setup, repeat the cycle.

How do OmmPlanner, Atelier and OmmViewer work together?

OmmPlanner helps you simulate instrument placement and coverage. Atelier configures and captures the measurement. OmmViewer processes the recorded data for review, validation and export. Together, they support the full measurement loop.

Which data formats does the Q-Series workflow use?

HDF5 keeps measurement data and metadata together. Export geometry and vibrometry in UFF, CSV or HDF5 to connect the measured response with design validation and downstream engineering analysis.

How does validation improve the next measurement?

Bring the findings back to OmmPlanner to refine instrument positions and coverage for the next test. The loop keeps your measurement strategy connected to the engineering question.

What should I provide for a software workflow demo?

Share your 3D geometry, measurement objective, Q-Series instrument and required outputs. We can demonstrate the route from planning and capture to analysis, validation and the next setup.