SEE MORE · KNOW MORE

See what moves when aeroacoustic noise appears

QSeries Laser RADAR gives aeroacoustics teams a clear view of structural motion in wind tunnels and operating rigs. Measure geometry and vibration across many points at once, then link the response to the sound, flow condition and design decision in front of you.

Explore acoustics, noise and vibration measurement.
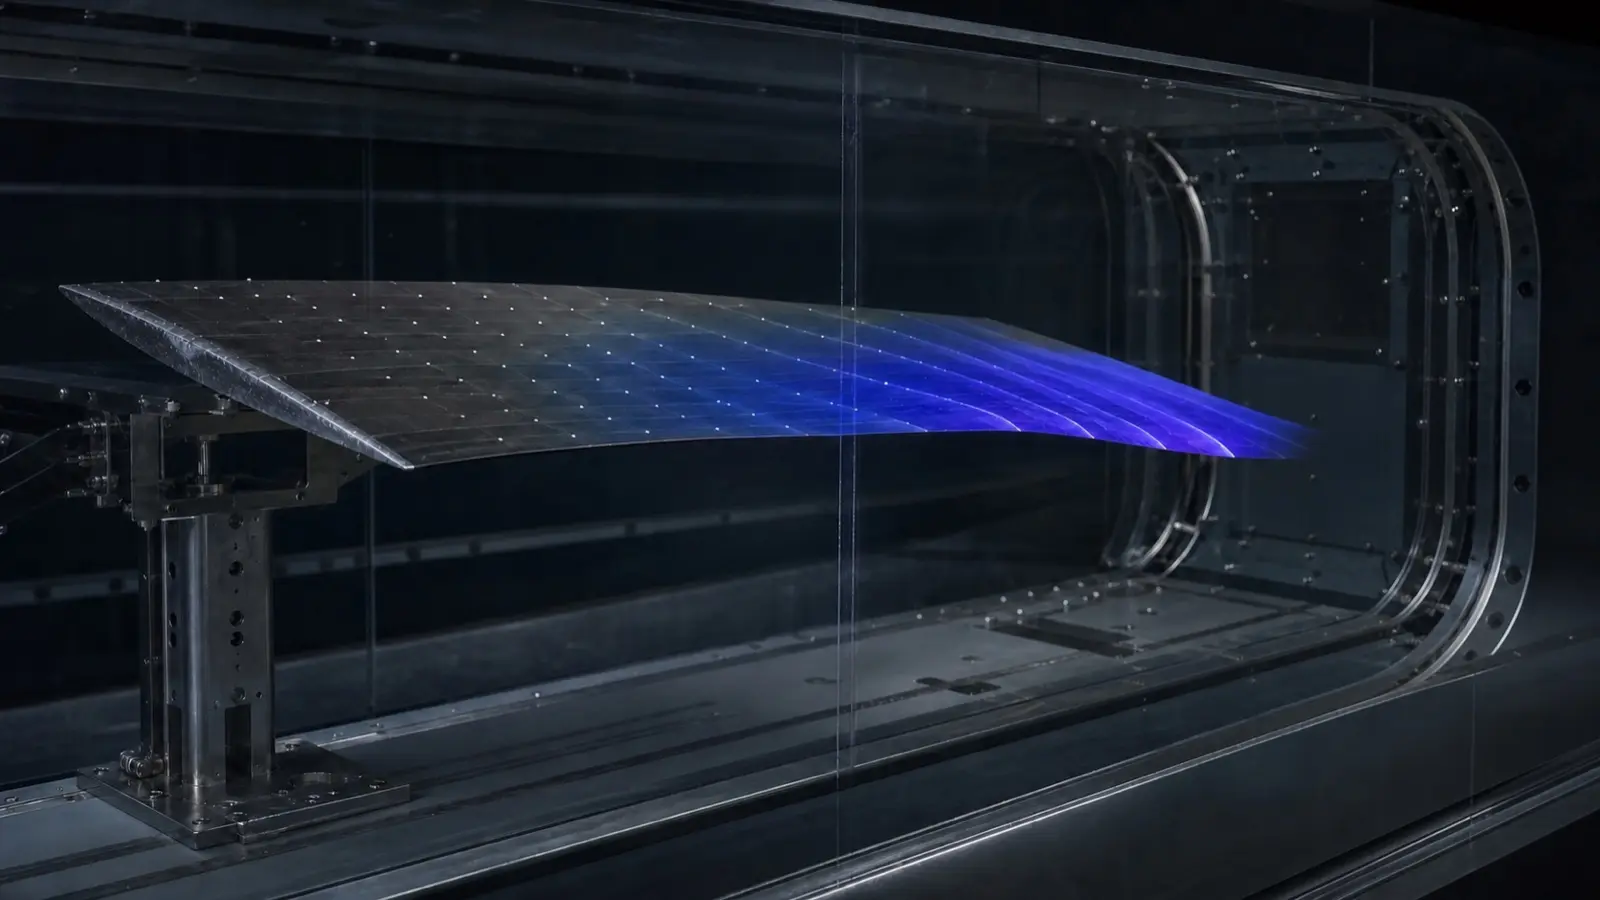
aeroelastic wing wind tunnel v2
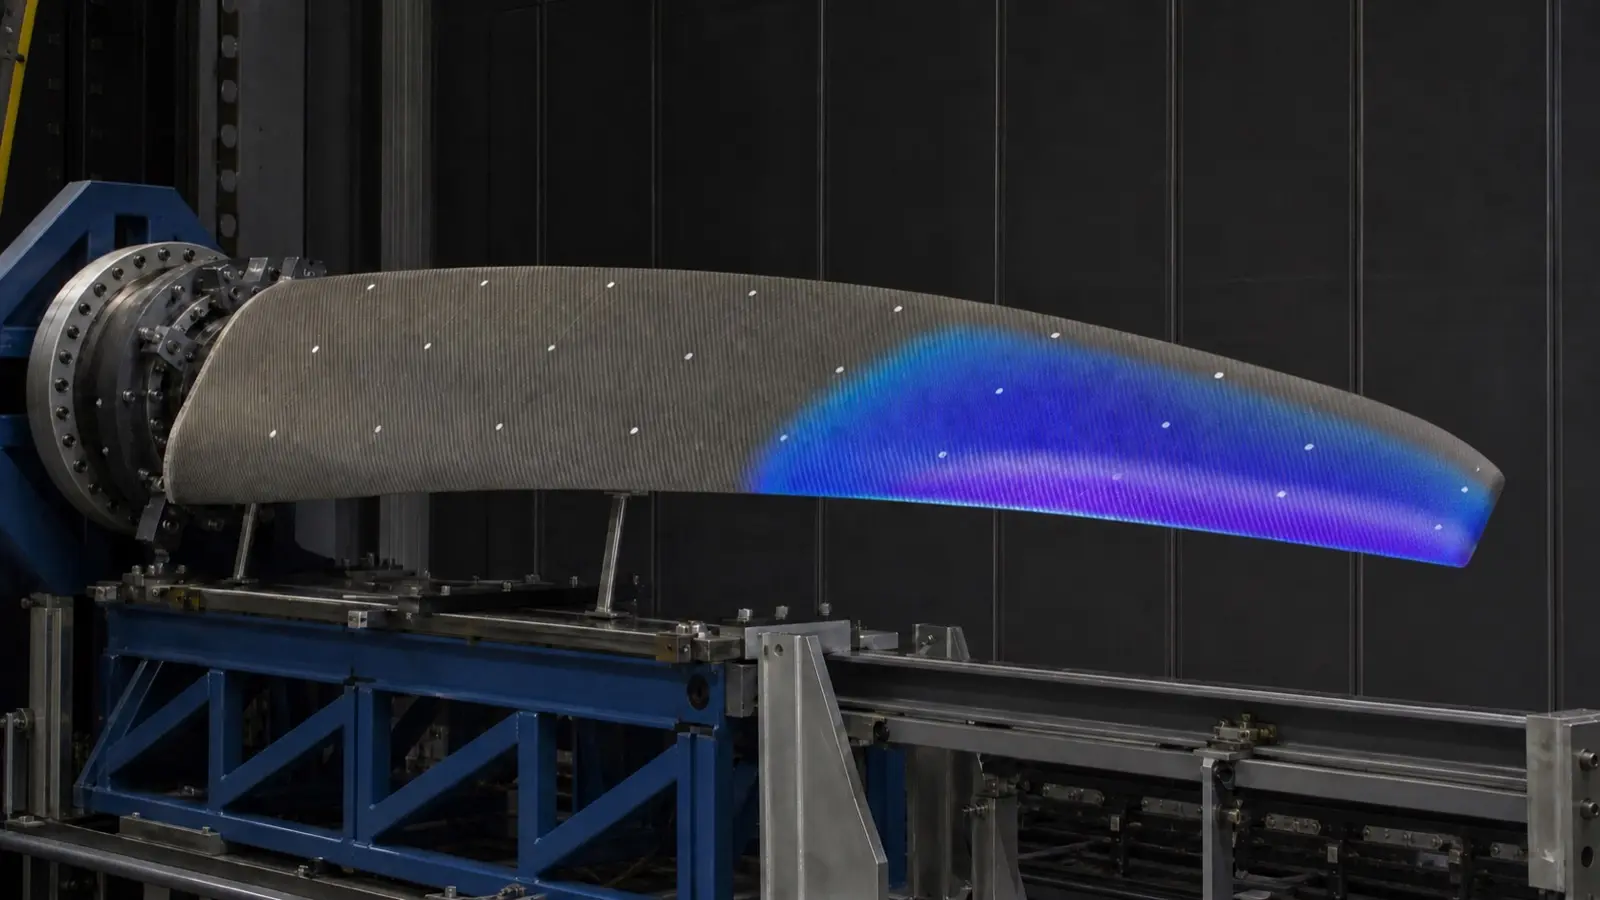
wind blade aeroelastic vibration v2

Turn aeroelastic data into a confident next step

Aeroelastic performance comes down to what the structure does under load. Map mode shapes and response across the test article, compare them with the model, and see where stiffness, damping or boundary conditions need attention before the next campaign.

Road-vehicle wind tunnels: find the path behind wind noise

Automotive wind noise rarely comes from one feature alone. Mirror and A-pillar flow, wheelhouse excitation, glazing and door seals all influence the cabin. Acoustic arrays show where noise starts; cabin microphones show what occupants hear. QSeries shows how the body side, glazing or trim is responding.
road vehicle wind tunnel aeroacoustics v1

See which change will move the result

Measure side glass, upper door, roof rail and body-side panels while the wind-tunnel condition reproduces the issue. Compare mirror, seal, glazing and trim variants with the same spatial evidence, then align the result with CFD, CAA and acoustic data.

For wider vehicle-development work, explore Automotive NVH vibrometry. Published wind-tunnel studies of side-mirror source identification and A-pillar, side-glass and interior transmission offer useful technical context.

Answer the question behind the noise

When the result could be a flow source, a structural mode or a transmission path, a spatial vibration map tells you where to look next.

Find the mode behind the tone

See the surface pattern behind a narrow-band tone, resonance or forced response.

Follow flow-induced vibration

Show where unsteady flow is driving a panel, blade, fairing, duct or casing.

Bring model and test together

Compare measured mode shapes and operating response with CFD, CAA and aeroelastic predictions.

Test the condition that matters

Capture structural response at the speed, flow setting or operating point that drives the decision.

Find the structural path in fan and duct noise
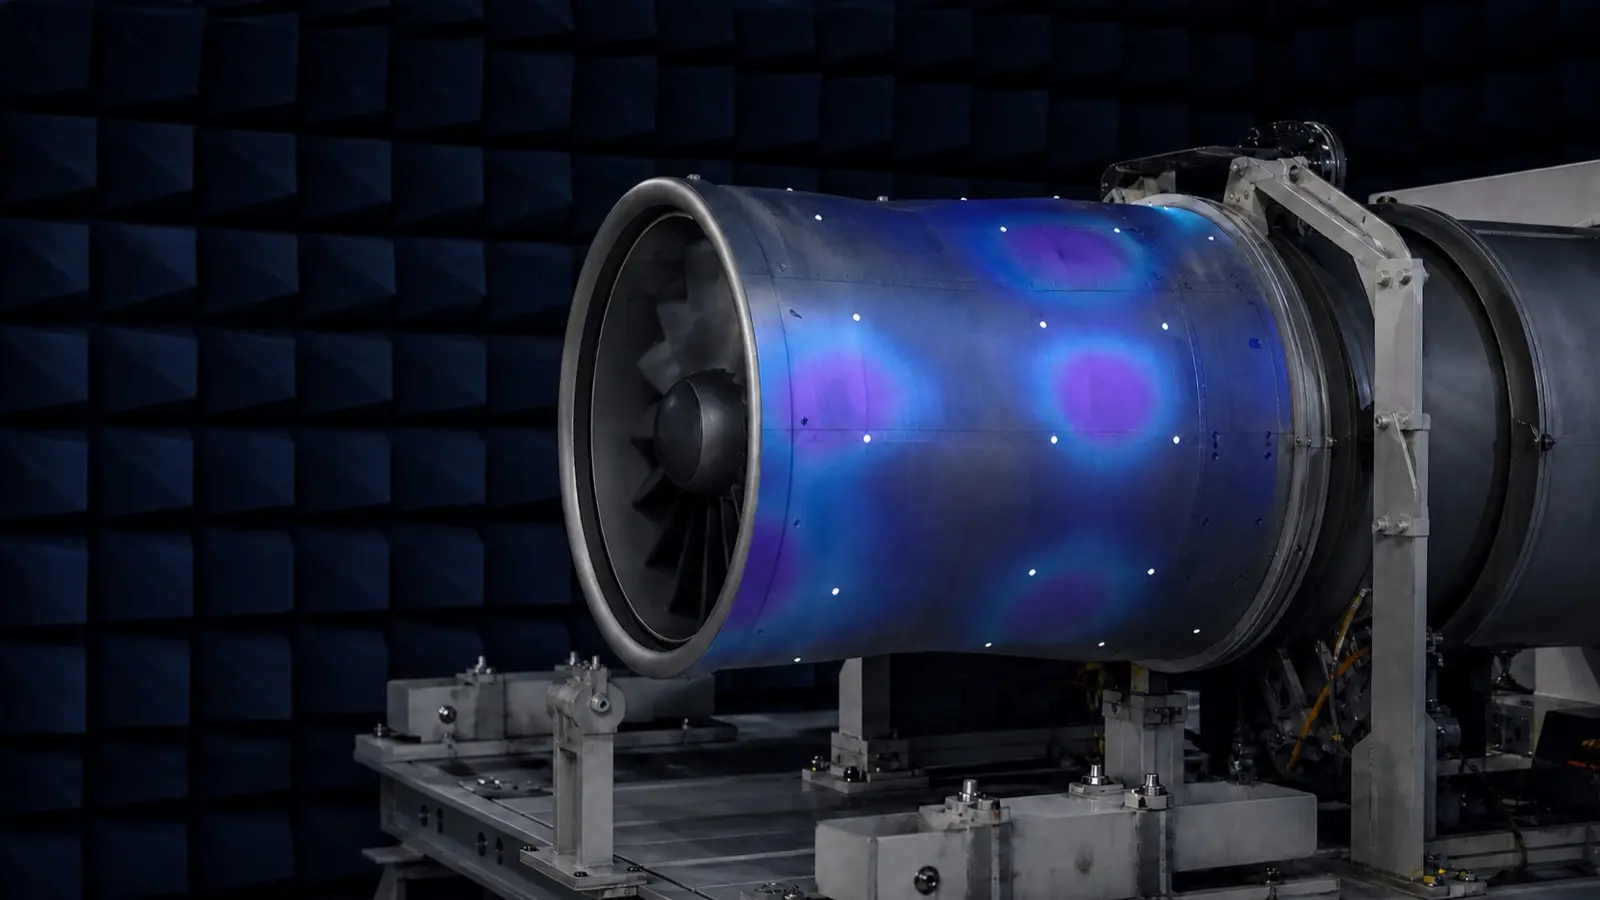
Fan and propulsor noise can travel through the rotor, stator, duct, casing, mounts and surrounding panels. QSeries maps the response around the rig so your team can pinpoint local modes and transmission paths alongside microphone, pressure and performance data.
Use that view to prioritise the next geometry, damping, mounting or acoustic-treatment change.
ducted fan aeroacoustic vibration v2

Use the right signal for the decision

Strong aeroacoustic test programmes connect flow loading, sound and structural response. QSeries gives the structural view that completes the picture.

What is heard

Measure level, spectrum and source correlation at the observer or array location.

What is loading the surface

Capture local pressure fluctuation and flow-driven excitation where the load is in question.

Trusted motion at selected points

Use them as reference channels on known critical components.

Where the structure is responding

Map geometry and vibration across many points in parallel, so the active surface or mode is clear.

Bring structural motion into the aeroacoustic test

See how Laser RADAR turns an aeroacoustic test article into a spatial measurement target. Apply the same workflow to connect structural motion with acoustic and flow data.

From noise result to design action

Bring the vibration map together with microphone data, pressure measurements and the operating condition. Then decide whether the next change belongs in the surface, structure, mounting or treatment.
Video: non-contact Laser RADAR measurement for aeroacoustic and flow-induced vibration studies.

Plan the measurement that answers the decision

Bring the test article, operating point and decision you need to make. We’ll help shape a practical QSeries study.

Explore Q1 Laser RADAR

Explore a focused Laser RADAR route for aeroacoustic rigs and wind-tunnel studies.

Explore Q2 Laser RADAR

Explore high-density parallel measurement for large or complex aeroacoustic test articles.

Discuss your application

Tell us the noise or vibration issue, the test condition and the design decision.

Aeroacoustics and flow-induced-vibration questions, answered

QSeries measures geometry and vibration across many points in parallel. Use it to map the structural response of wings, blades, panels, ducts, casings and other aeroacoustic test articles.
Yes. Measure the surface or load path during the operating condition that matters, then see where unsteady flow is driving the structural response.
Yes. Compare measured frequencies, mode shapes and operating response with the aeroelastic model, then refine the structural, boundary-condition or damping assumptions that matter.
Yes. A QSeries campaign is planned around optical access, the test section, the flow condition and the surfaces you need to understand.
Yes. Map accessible casings, ducts, mounts and nearby panels alongside microphone and pressure data to identify the structural path that needs attention.
No. Microphones show the acoustic outcome and pressure sensors show the loading. Laser RADAR shows how the structure responds, giving the team a complete diagnostic view.
Yes. Use spatial response maps to study blade dynamics, mode shapes and aeroelastic behaviour in the laboratory or another suitable test environment.
Flow-driven response often extends across a surface. Parallel multi-point measurement makes the active shape and location clear, rather than relying on a short list of sensor locations.
Laser Doppler vibrometry provides velocity and vibration information. QSeries brings that capability together with geometry measurement and parallel multi-point acquisition.
Bring the test article, operating condition, suspected noise or vibration feature, available access, expected frequency range and any acoustic, pressure or model data. That is enough to define a useful starting route.
Yes. In a road-vehicle wind tunnel, use QSeries to map accessible glazing, body-side panels, roof structures and other surfaces while the condition reproduces the wind-noise issue.
Acoustic arrays locate exterior source regions and cabin microphones quantify the result. QSeries maps the structural response of the surfaces between source and receiver, helping you choose between a flow, glazing, seal, trim or body-side intervention.
Start where the complaint and source evidence point: A-pillar and side-glass regions, mirror interfaces, upper door and roof-rail structures, wheelhouse-adjacent panels, glazing and door-seal interfaces.

Plan the measurement that answers the decision

Bring the test article, operating point and decision you need to make. We’ll help shape a practical QSeries study.

Continue your structural-dynamics review

Apply full-field response measurement to energy assets

Explore the energy route for wind-turbine blade testing, in-service response and transformer diagnostics.