
Mechanical model validation with geometry-linked UFF data
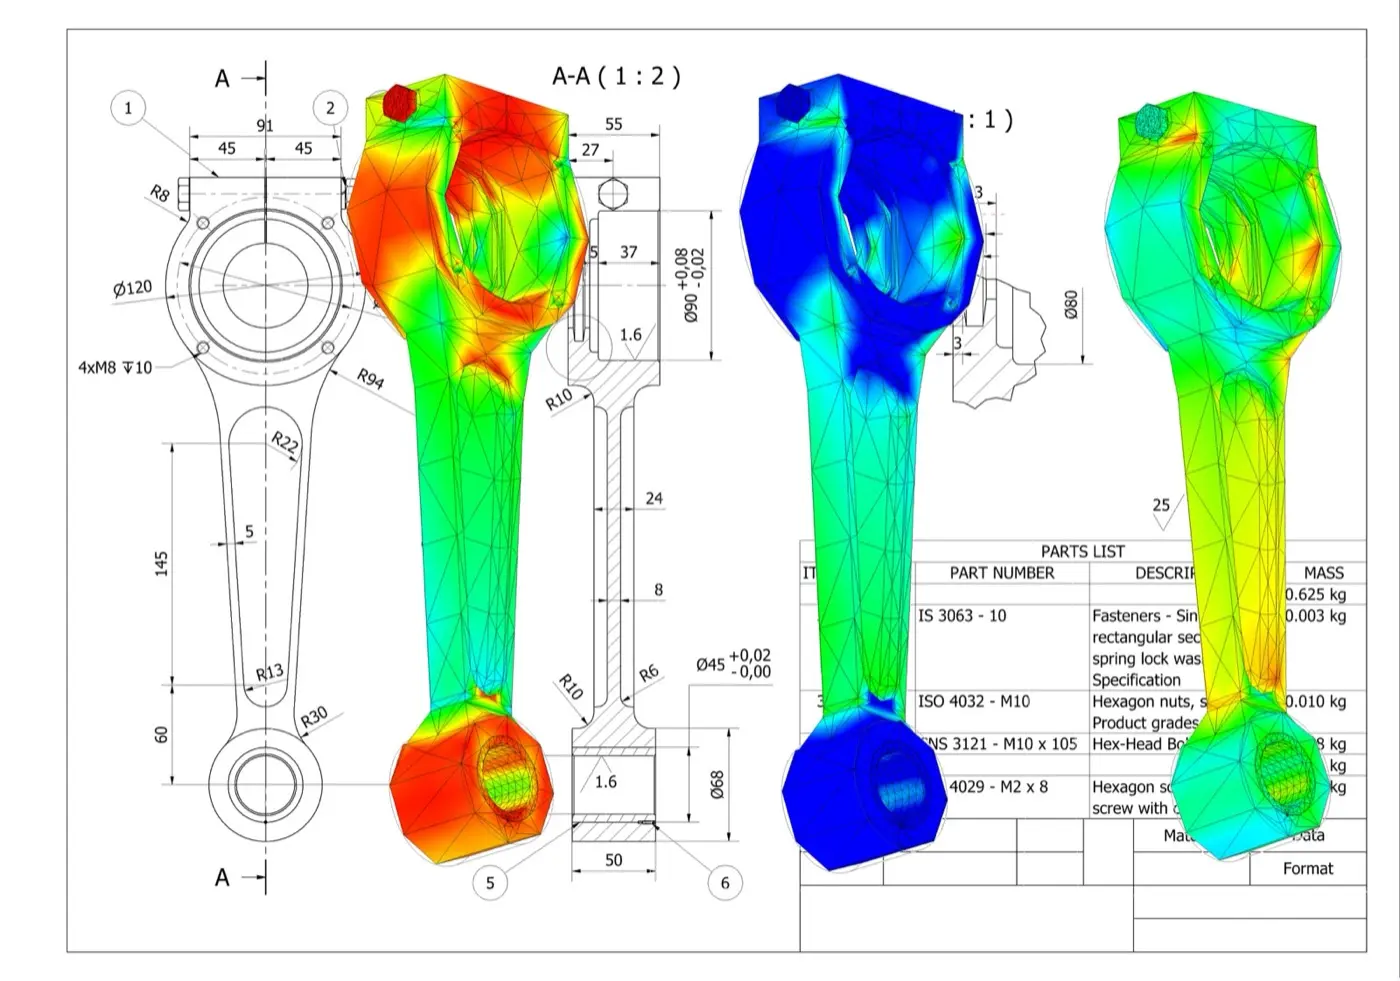
One UFF handoff
Geometry, waveforms and FRFs
XYZ coordinates, tri-axial velocity waveforms and FRFs remain associated with each measurement record.
A direct path from test to FE correlation
1. Define
Set the geometry, test points, response directions and excitation reference.
2. Measure
Capture dense non-contact velocity data and combine it with force, acceleration, displacement or strain references.
3. Correlate
Review modes, frequency and damping estimates, FRF overlays, MAC, COMAC and other correlation indicators.
4. Update
Focus the model on the joints, boundaries, material properties and local stiffness that drive the mismatch.
Keep response location and direction intact
Link point and response
Geometry and response records arrive together, so channels do not need to be reconstructed against coordinates.
Preserve direction
XYZ output identifies the response direction at each test degree of freedom.
Start analysis sooner
Import the test model and move into visualisation, parameter estimation and correlation.
See the regions that drive the mismatch

Complex structures
Cover panels, assemblies, frames and larger structures with the spatial detail needed to interpret the measured response.

Small components
Measure local mode shapes where conventional sensor placement is intrusive, impractical or too sparse.
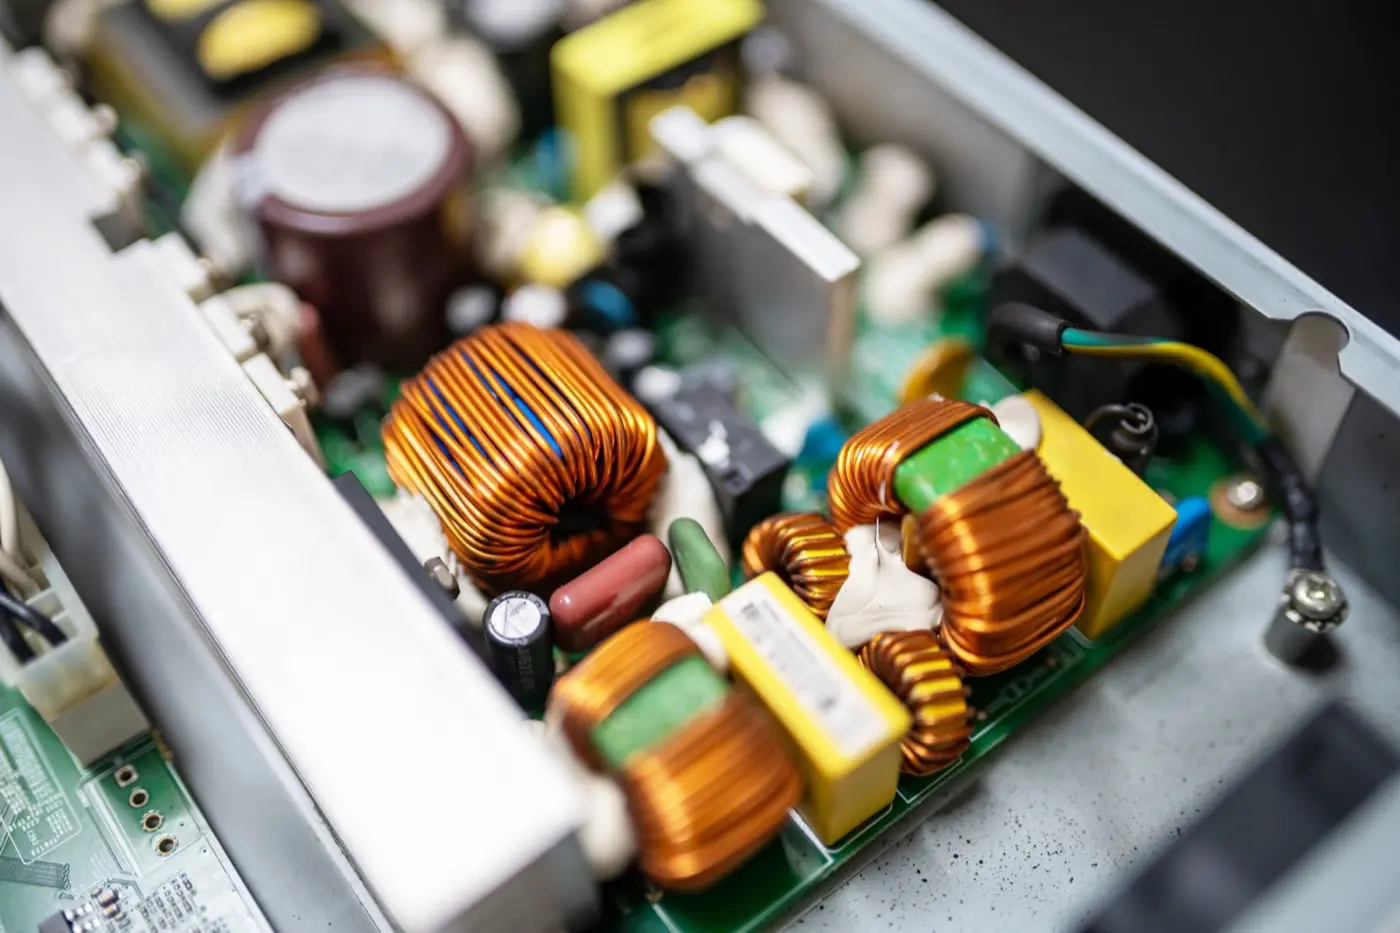
Measure small features without a dense sensor array
Use Laser RADAR for coverage and retain the complete test model
UFF export
Transport test geometry and structural-dynamics data into the modal and correlation environment your team uses.
Geometry-aware review
Open a test model with points, directions, waveforms and FRFs linked before animation or correlation begins.
Your analysis workflow
Keep your existing analysis package, naming conventions and validation criteria.
Resources for the next model-validation decision
Full-field modal-analysis workflow guide
Follow the end-to-end workflow from excitation and FRF acquisition through curve fitting, MAC review and UFF export.
Impact-test application note
See an impact-hammer test on a concrete slab using 65 simultaneous response measurements and geometry context.
PCB vibration application note
Explore high-density response measurement on populated electronics where local component behaviour drives qualification risk.
Products and application context
Q2 Laser RADAR
For complex parts, dense dynamic coverage and integrated 3D geometry in one measurement workflow.
Q1 Laser RADAR
For large or difficult-to-access structures that need stand-off geometry capture and vibration insight.
Acoustics, noise and vibration applications
Browse vibration, modal-testing and NVH applications by engineering question, structure and measurement constraint.
Practical answers before you plan the test
The export can keep measurement geometry, coordinates and Q-Series vibration results together for compatible downstream tools, including response and FRF data when the test provides the required input reference. Confirm the exact UFF dataset, units, coordinate convention and receiving-tool requirements for the software release and workflow.
An FRF relates measured structural response to a measured input across frequency. In an impact or shaker modal test it helps identify resonances, estimate modal parameters and compare the test response with a finite-element model. An output-only vibration spectrum is not automatically an FRF.
Yes, when the hammer force is acquired as the time-aligned input reference and Laser RADAR records the vibration response over the selected geometry. Triggering, timing, coordinate directions, bandwidth, windowing and force quality must be controlled before calculating or exporting FRFs.
Match the coordinate system, measurement locations, response directions, units, boundary and operating conditions, frequency range and quantity being compared. Clear correspondence makes differences in natural frequency, damping, mode shape and FRF meaningful instead of artefacts of setup or mapping.
Yes. Engineers can review measured FRFs or identified modal parameters, compare them with model predictions and use the observed differences to guide updates. The software does not validate or update the model automatically; parameter selection, acceptance criteria and engineering interpretation remain part of the analysis.
No. UFF is an exchange format that can shorten the handoff of compatible geometry and measurement data. Modal identification, correlation, model updating, uncertainty review and reporting still require suitable downstream software, a defined method and qualified engineering judgement.