Q2 Laser RADAR for biomedical motion research
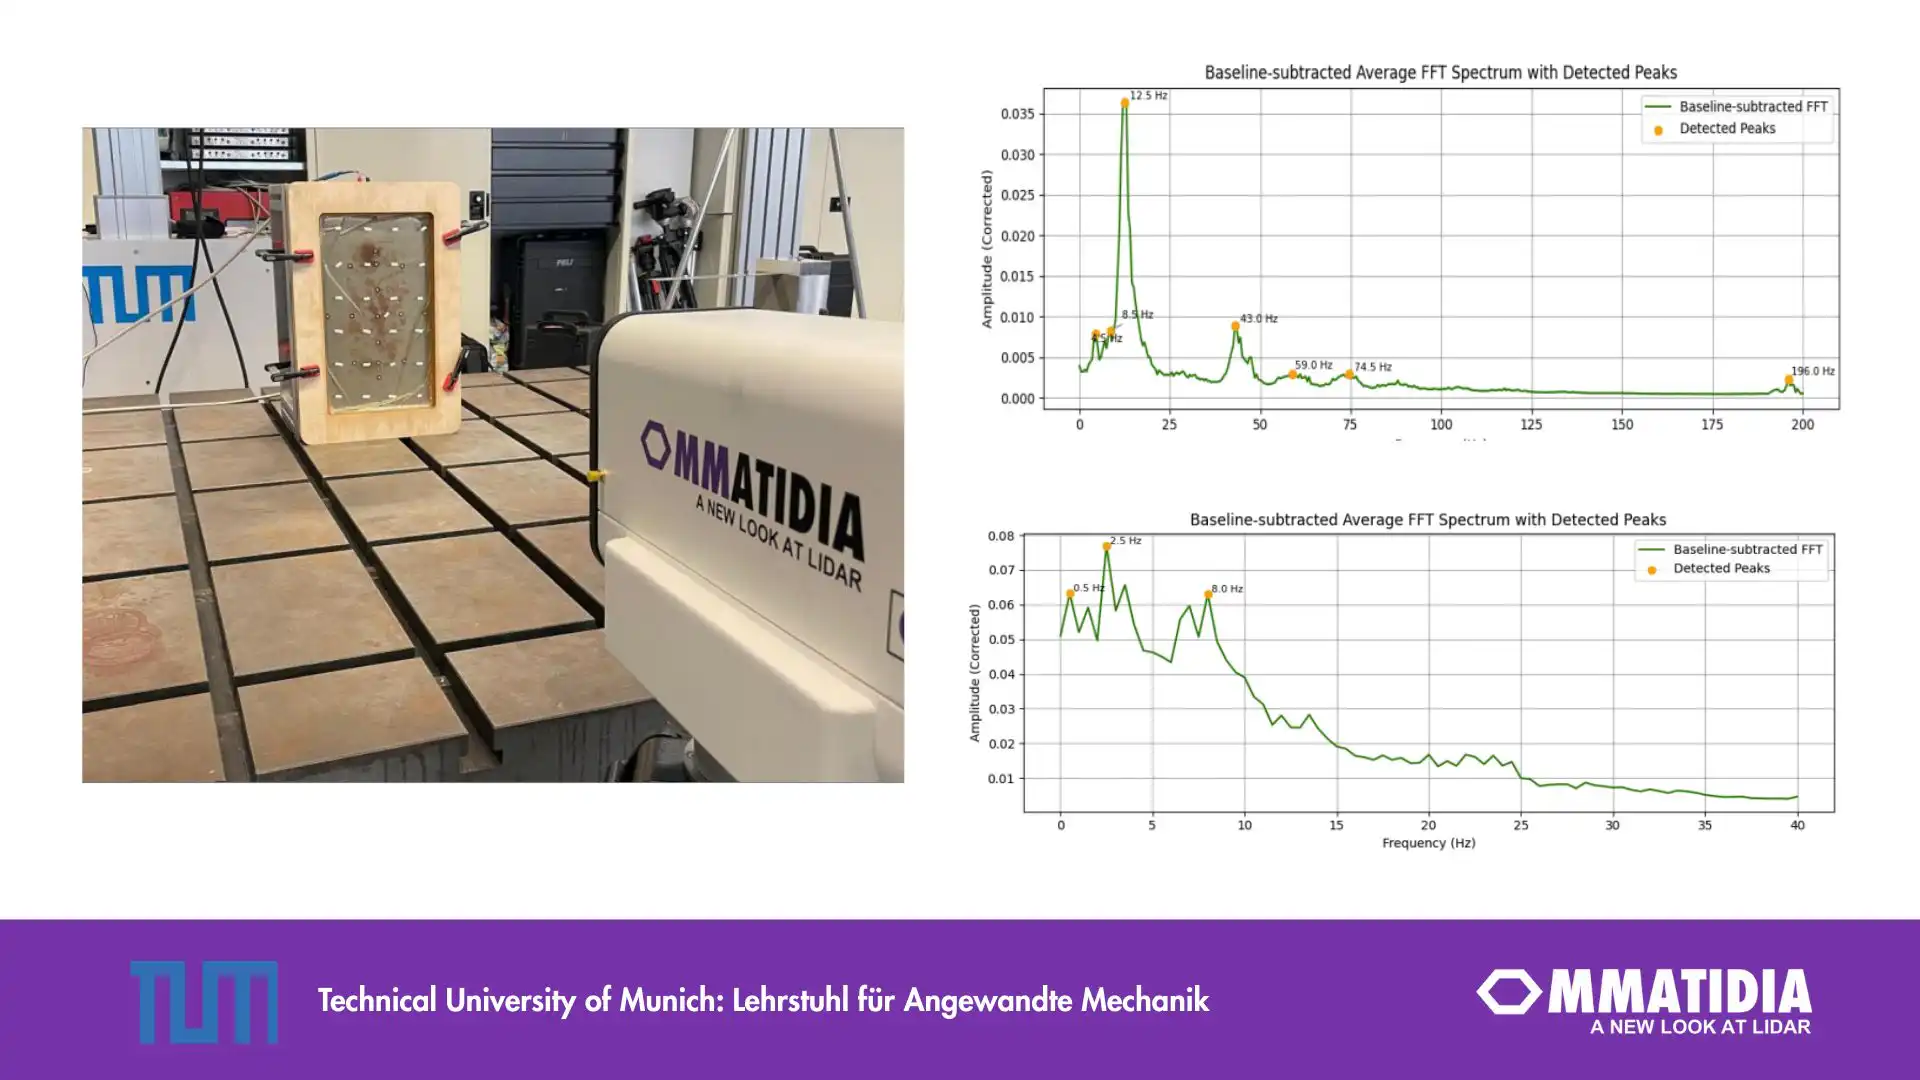
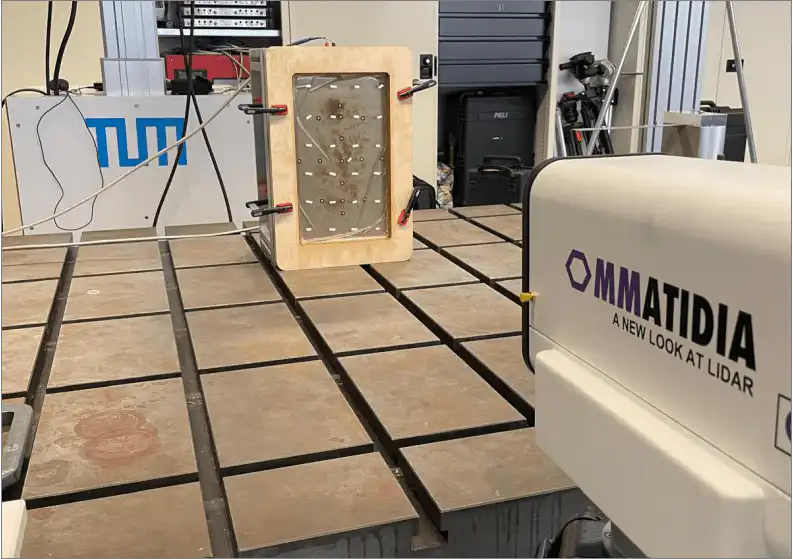
Munich, Germany | 13 May 2025 — Ommatidia measured full-field surface motion at the Technical University of Munich (TUM), using Q2 Laser RADAR to connect vibration time series with spatial response maps.
Discuss your biomedical measurement study
Share your target motion and measurement requirements with our team to select a Q2 research workflow.
At Prof. Dr. Daniel Rixen’s invitation, Eduardo Margallo and Óscar Enríquez worked with Dr.-Ing. Johannes Maierhofer and the Chair of Applied Mechanics on the biomedical measurement setup.
From surface motion to spatial vibration maps
Q2 combines distance and velocity measurements without attaching sensors to the target. Researchers obtain a spatial view of vibration alongside its time and frequency response.
Explore Q2 Laser RADAR and its parallel measurement workflow.
TUM test setup: a gelatin abdominal phantom
A gelatin abdominal phantom represented the tissue-like test surface. A simulated blood-pressure waveform drove mechanical vibrations, and Q2 measured the resulting surface-velocity field.
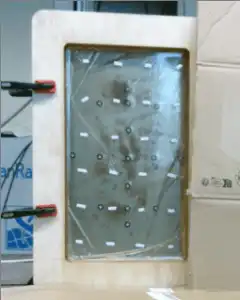
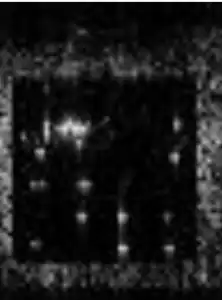
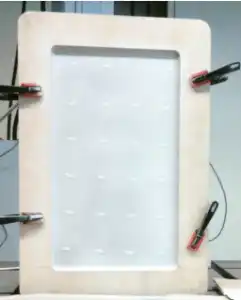
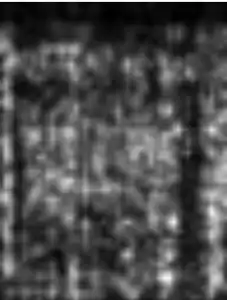
Phantom and optical intensity before and after surface coating
Measured results:
-
The phantom measurement setup was completed in under 15 minutes
-
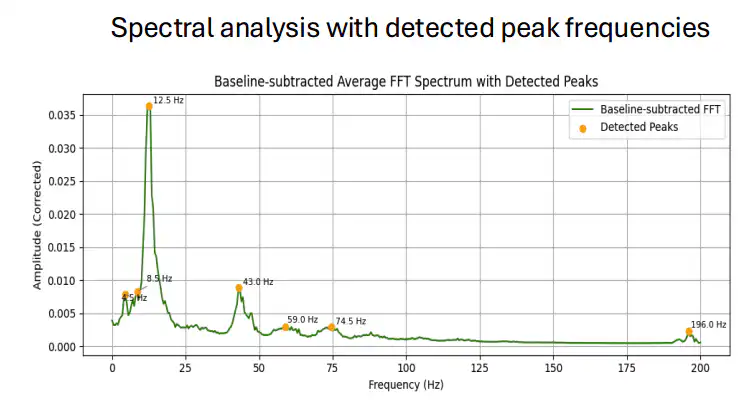
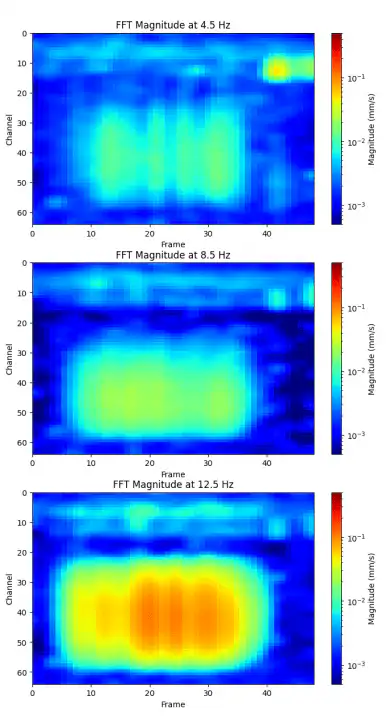
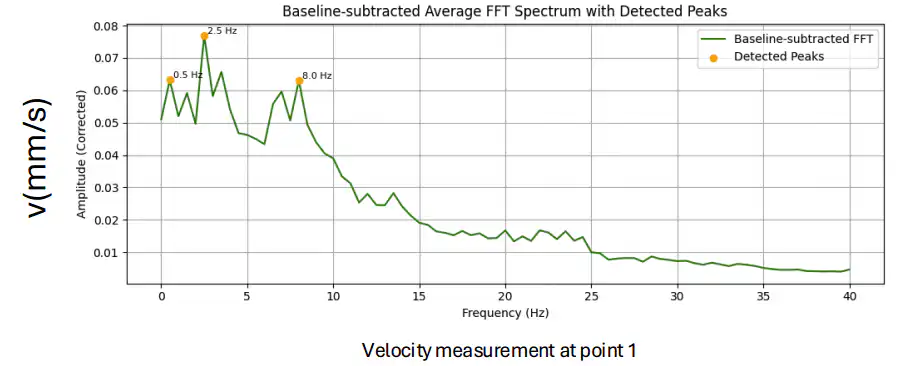
Frequency peaks were measured at 4.5, 8.5, 12.5, 19.6 and 74.5 Hz
-
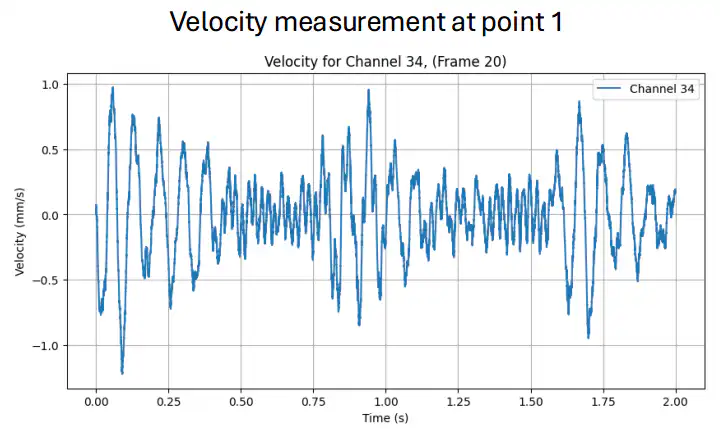
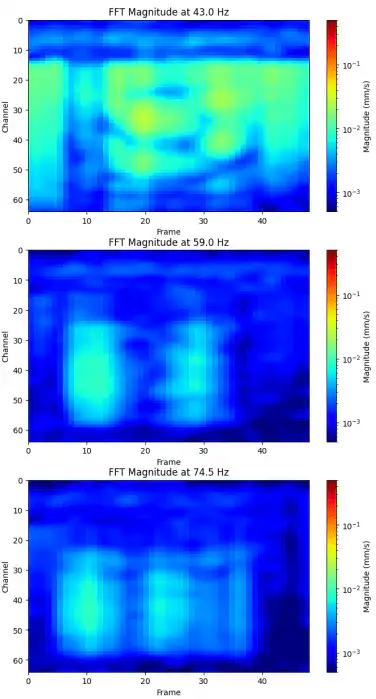
Velocity time series and FFT maps connected spectral response with spatial position
-
Coating the phantom surface increased the recorded optical intensity
The measurements linked frequency peaks with full-field surface response, giving the team a quantified dataset for follow-up experiments.
Spatial vibration maps at the measured frequency bands
Arm-motion measurements at Ommatidia
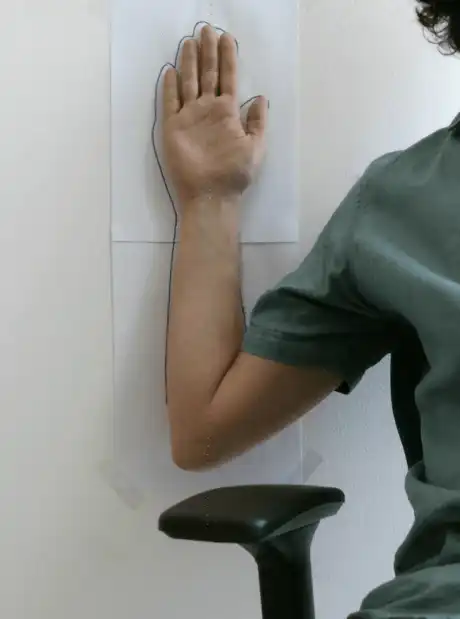
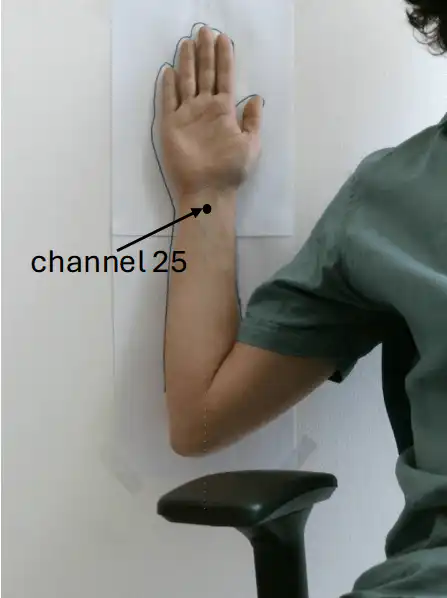
Further measurements at Ommatidia captured surface motion on a human arm without attaching sensors.
The acquisition included:
-
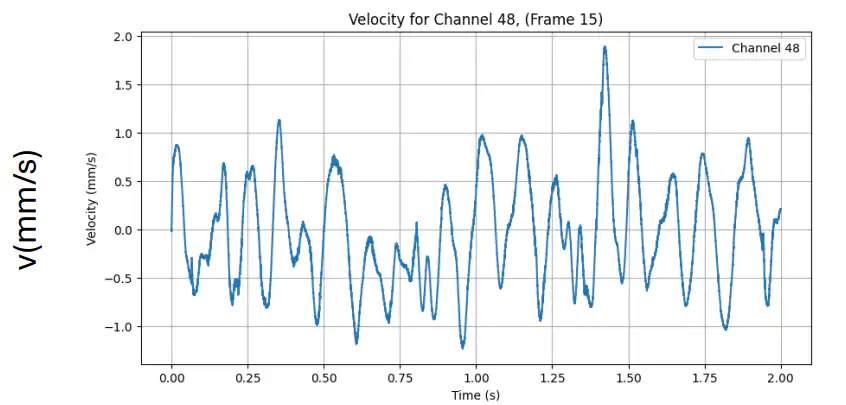
A two-second step scan across the arm
-
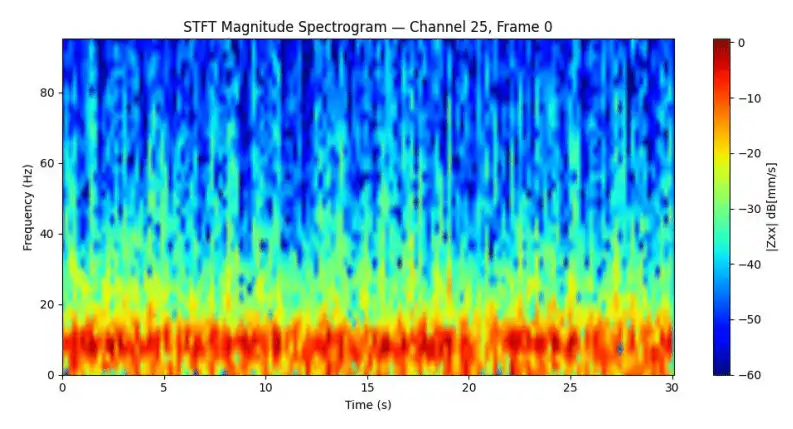
A 30-second line measurement for continuous spectral data
The scans produced surface-velocity traces and spatial spectral data for investigating arm motion.
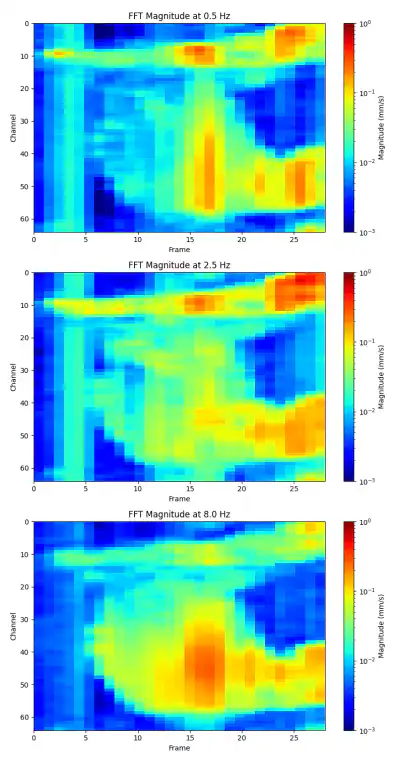
Thirty-second line measurement
Practical tools for biomedical measurement research
Build a study around the motion, spatial coverage and output you need:
-
Efficient setup: the reported phantom setup took under 15 minutes
-
Non-contact acquisition: measure the surface without attached sensors
-
Frequency analysis: combine velocity time series with spectral maps
-
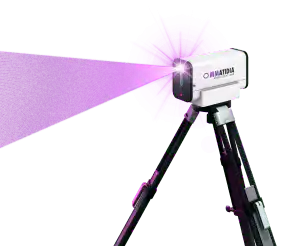
Compact design: tripod-mounted and portable between measurement positions
-
Analysis-ready output: velocity traces and spatial response maps
Share your target motion and measurement requirements with our team to select a Q2 research workflow.
Plan a repeatable measurement study
Ommatidia Q2 Laser RADAR for non-contact vibrometry
Use full-field measurements to connect the test geometry with dynamic response and build a repeatable research dataset:
-
Full-field surface-velocity measurement
-
Repeated measurements with controlled excitation
-
Spatial comparison of vibration frequency signatures
-
Time-synchronized motion datasets
Discuss your biomedical measurement study
Biomedical researchers and engineers can work with Ommatidia on target selection, acquisition settings and data analysis.
Ommatidia Upgrade & Trade-In Program
Upgrade to Ommatidia’s latest Laser RADAR technology and unlock more capability for your next measurement challenge. Whether you are expanding an existing setup or replacing an older system, we offer tailored upgrade options with discounts of up to 40%.
If you are currently using another manufacturer’s system, send us your model and measurement requirements. We will review your trade-in possibilities, identify the best Ommatidia configuration, and outline a practical upgrade path for your team.