Non-contact bridge vibration and strain mapping near Thessaloniki
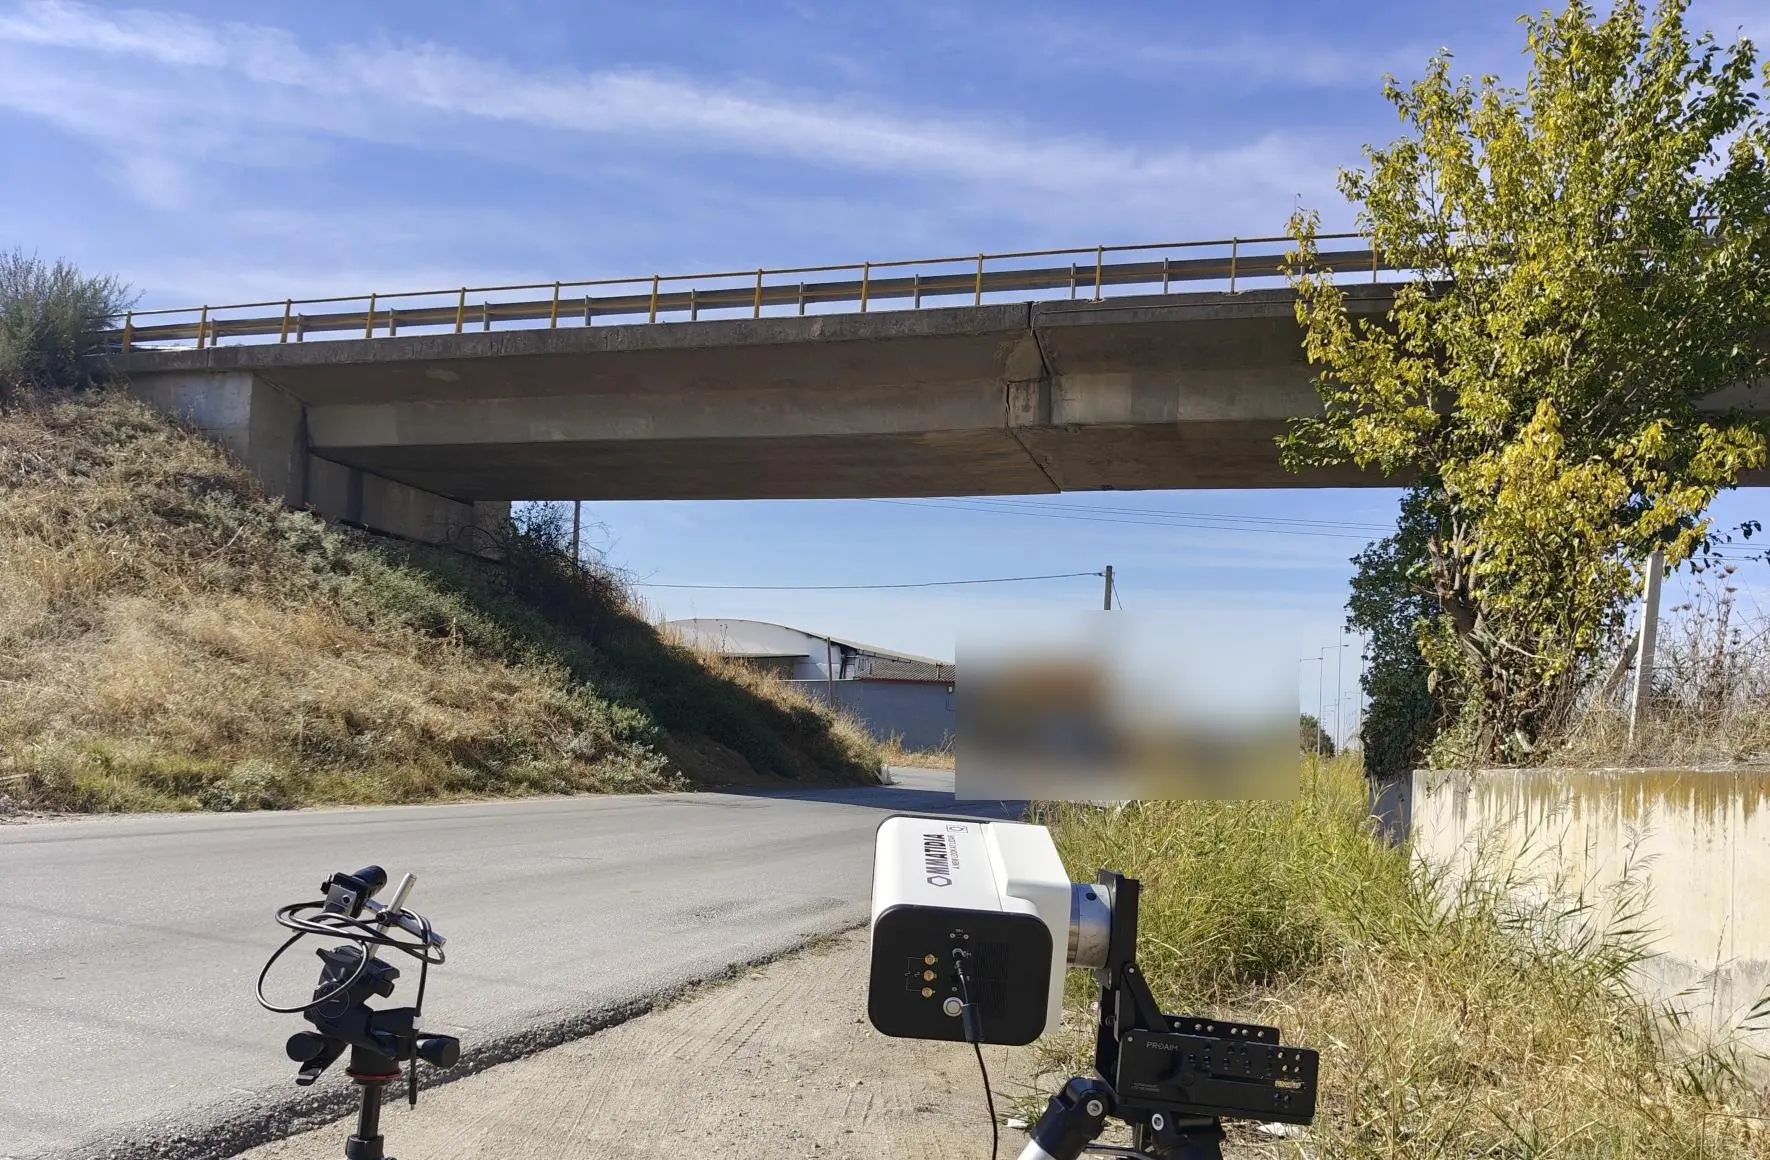
On the Kalohori motorway entrance overpass near Thessaloniki, Ommatidia Q2 laser radar captured velocity at 109 locations in a five-minute roadside campaign, under normal traffic and without bridge-mounted sensors.
The same spatial record connects vibration modes, traffic-driven displacement and motion-derived soffit strain, giving engineers a detailed view of how the bridge responds along the measured line.
Bridge response under normal traffic, from one roadside setup
The field team positioned Q2 on the service road below Side 2, with a view across the cantilever and into the 45 m span. Every optical location became a simultaneous velocity channel, preserving the same traffic event across the measured line.
Comparing those channels reveals where response changes locally and how motion develops from the support region into the span.
300-second campaign
A focused roadside acquisition captured the bridge response while normal traffic continued.
109 measured locations
A dense spatial line showed how response develops from the support zone into the span.
No bridge-mounted sensors
The system observed the underside remotely from an accessible field position.
Place the measured response in the bridge geometry
The measured line covered approximately 6.18-22.88 m from the Q2 position, passing the support at about 10.5 m and extending into the 45 m span. The drawing locates the supports and hinges; the planning view shows the instrument position and beam paths beneath the deck.
Explore OmmPlanner measurement planning and editions to relate instrument placement and available sightlines to the structure before a campaign.
Bridge dimensions and beam sightlines place the roadside measurement in the same structural context. Drawing dimensions are in metres.
Velocity, modal response and deformation from one capture
Q2 recorded deck-normal velocity across 109 locations at the same instant. Operational modal analysis resolved the recurring vibration response; integration gave displacement under traffic; spatial curvature and section geometry gave the soffit bending-strain estimate.
- Vibration modes: frequencies and spatial response shapes.
- Traffic response: velocity and displacement during the same vehicle passages.
- Deformation: a motion-derived strain map along the box-girder underside.
Six identified modes, tied to their spatial response
Operational modal analysis with pyOMA2 selected six cluster-medoid modes from 1.44 to 15.47 Hz. Repeated poles across model orders were assessed with their response shapes and compared with frequency-domain decomposition.
In the stabilization chart, colours distinguish clusters, grey marks discarded poles and dashed lines identify medoids. The first bending mode at 1.44 Hz changes sign near the support; the mode shapes show how relative motion develops along the observed line.
Explore the measured mode shapes
The spatial mode shapes relate each identified frequency to motion along the measured bridge line, showing where adjoining locations move together or in opposite directions.
Traffic makes the bridge response visible
The original velocity traces compare locations at 8.49, 14.37 and 20.37 m during the same 20-second traffic event. Their shared time axis shows where response is stronger and how the oscillation evolves along the structure.
Nine passages were identified in the 295-second analysis record. The current displacement processing gives a maximum absolute deck-normal response of 5.5 mm in the strongest minute.
From measured motion to local strain detail
Integrating the deck-normal velocity gives displacement. The dense spatial profile provides curvature, which is combined with the section geometry to derive bending strain at the soffit.
Using a neutral axis 0.90 m above the soffit, the campaign reported peaks of +20 and -26 microstrain in the central analysis zone. This connects deformation detail with the same recorded traffic response. Read more about motion-derived bridge strain.
Displacement and strain through the strongest minute
The upper trace shows deck-normal displacement at 17.1 m. The heatmap below follows motion-derived soffit strain along the measured line: red denotes tension and blue compression as a moving load passes the pier region and enters the span. The dotted line marks the pier; whitened bands identify the edge zones.
Project acknowledgements
EuroTech SA, Ommatidia’s authorised distributor in Greece, supported the local demonstration. The campaign took place on the Kalohori motorway entrance overpass near Thessaloniki, operated at the time of the campaign by Egnatia Odos AE.
Plan your next bridge measurement
Connect modal characterisation, live-traffic response and motion-derived strain in one focused laser radar campaign. Explore bridge structural monitoring or discuss the geometry and response you want to resolve.
Ommatidia Upgrade & Trade-In Program
Upgrade to Ommatidia’s latest Laser RADAR technology and unlock more capability for your next measurement challenge. Whether you are expanding an existing setup or replacing an older system, we offer tailored upgrade options with discounts of up to 40%.
If you are currently using another manufacturer’s system, send us your model and measurement requirements. We will review your trade-in possibilities, identify the best Ommatidia configuration, and outline a practical upgrade path for your team.