Full-field diesel engine vibrometry at UPM School of Naval Engineering
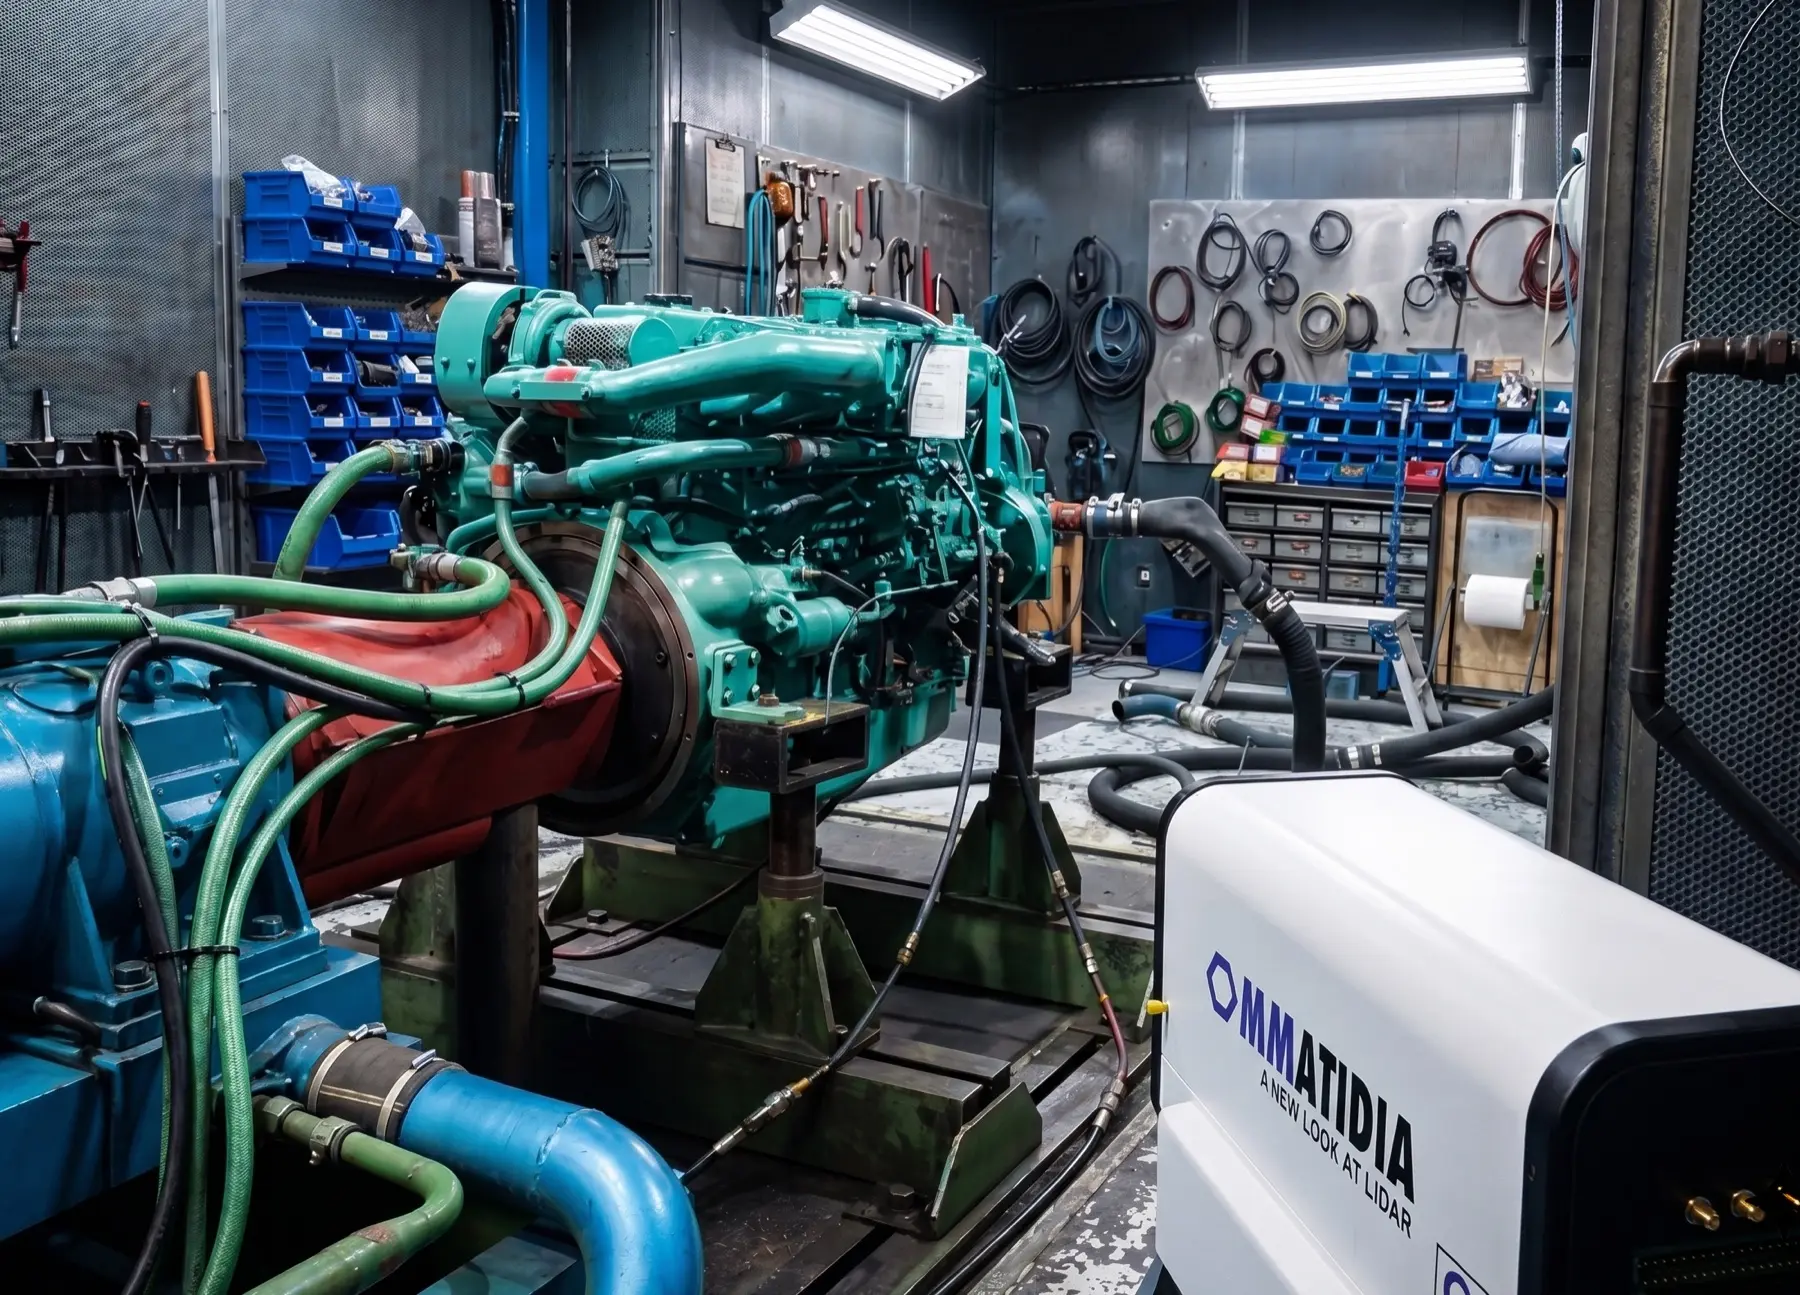
See how full-field laser vibrometry supports diesel engine vibration analysis without installing contact sensors. Ommatidia Q2 Laser RADAR captured 65 simultaneous vibration signals across a running Doosan L136T engine, producing a spatially referenced dataset for faster diagnosis.
What the measurement made visible
At the UPM School of Naval Engineering, the test campaign combined multibeam laser vibrometry, 3D point-cloud capture and synchronous signal analysis to turn an operating engine into actionable diagnostic evidence.
65 simultaneous beams
A dense parallel acquisition makes local vibration patterns visible in the same operating event.
Three operating speeds
Measurements at approximately 800, 1300 and 1900 rpm show how the spectral behavior evolves.
Spatial vibration maps
Velocity-amplitude maps locate the A/B spectral families and connect frequency content to the engine structure.
From test bench to spatially referenced data
The Doosan L136T engine was tested with Ommatidia’s 65-beam Laser RADAR and a BCB Informática IR camera. The team acquired a 3D reconstruction of the engine block and synchronized time and spectral signals across the measured positions.
The resulting point cloud provides a global reference for vibration maps, FEM comparisons, optical targets and future thermomechanical correlation.
What the spectra revealed as speed changed
The measurements identify the rotation frequency, upper harmonics and a 1:2 subharmonic—consistent with four-stroke engine kinematics—then show a more nuanced behavior at the intermediate speed.
~800 rpm
The integrated spectrum shows a 13.9 Hz first harmonic, a 7.0 Hz 1:2 subharmonic and a principal peak at 41.8 Hz.
~1300 rpm
Harmonics split into two frequency families whose separation grows with frequency and whose spatial patterns do not coincide.
~1900 rpm
The spectral splitting disappears, indicating a speed-dependent torsional mode or coupling effect outside resonance.
1300 rpm: two spatially distinct harmonic families
At the intermediate speed, the harmonic structure separates into two families. The 11.0 Hz, 43.0 Hz and 64.5 Hz responses share one spatial pattern (A), while the 55.0 Hz and 66.0 Hz responses form a second family (B). This is the evidence behind the speed-dependent split described above.
Detected spectral peaks
Baseline-subtracted average FFT: the separation between peak series becomes more visible as frequency rises.
Time-domain response
Representative two-second velocity trace from the 1300 rpm operating condition.
Its rapidly varying waveform shows why the frequency-domain view is essential: the harmonic families are easier to separate in the FFT and then locate across the measured engine structure.
Spatial vibration maps identify the A/B families
The maps localize each frequency family across the measured channels and frames, showing that the A and B responses do not coincide spatially.
Start-up behavior: frequency content settles as the engine reaches speed
The start-up record adds time-frequency context to the steady-state maps. The velocity signal and STFT show the transient response before the spectral content stabilizes.
Channel 16 velocity during start-up
Channel 16 shows the transient increase in vibration amplitude as the engine accelerates, then the more stable response after it reaches operating speed.
STFT magnitude spectrogram
The spectrogram makes the settling process visible in frequency: dominant bands emerge during the ramp and consolidate once the engine is running steadily.
A non-contact path to engine diagnostics and predictive maintenance
For engine teams, the value is simple: see where vibration is occurring, compare frequency families across the structure and focus follow-up investigation on the areas that matter. The same approach supports test-bench development, troubleshooting and condition-monitoring programmes.
Apply this workflow to your engine programme by correlating harmonic separation with torque and RPM, testing under representative loads and governor settings, integrating thermography, and bringing spectra, vibration maps and thermal data together in an automated diagnostic workflow.
Explore how Laser RADAR compares with scanning LDV, or review the wider remote laser vibrometry workflow for NVH and modal testing.
Choose the next step for your vibration programme
Download the application-note presentation, book a technical demo or speak with an engineer about your measurement challenge.